This is an unashamed “please point me in the right direction” question. I know some people on here have a much better understanding of physics and mechanics than I do…
So using this app… Physics Toolbox … I can export acceleration in x, y and z vs time to a CSV file and I want to use this data to plot the path of the object that experienced these accelerations.
Attached is a CSV file from simply throwing my phone across the room onto the sofa.
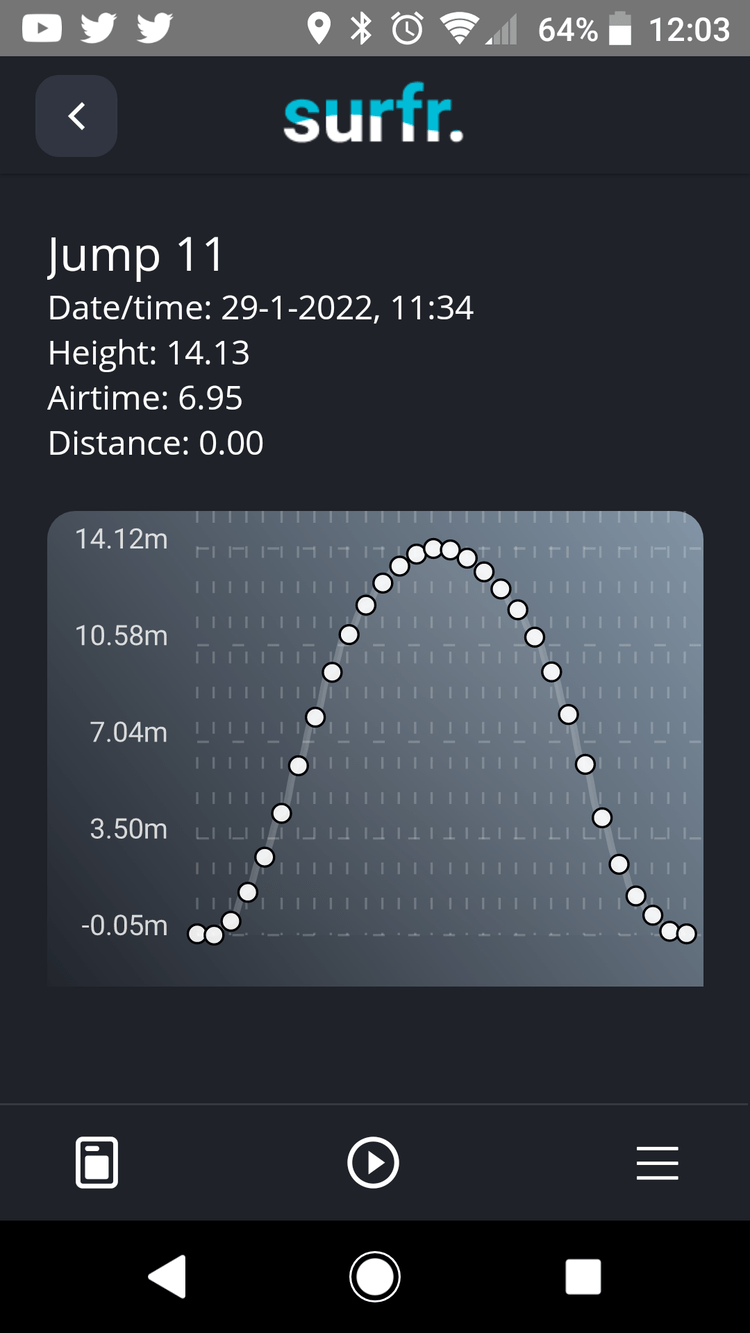
The inspiration for this is an app called SURFR which lets me carry my phone (in a waterproof case obvs) in my wetsuit or on my kiteboard and can record live how high I jump. It’s an awesome app… so much fun, and it can show a height vs time curve for each jump.
I’m interested in trying to create a 3d curve from the accelerometer data because I’m interested in the shape of this curve as it can show not just how high you went but how far and how fast during the jump.
I’d like to be able to visualise the trajectory curve and the force experienced at points along the curve.
To be able to get the actual motion path you need more than just the xyz accelerometer data.
(because that is in the plane of the phone. Think of rotating the phone in place - the xyz acceleration would be zero during this, but afterwards the orientation of the phone’s frame relative to the world has changed, so an acceleration in its local X axis means something different in world coordinates to what it did before the rotation)
Do you also have a record of the gyro readings?
It takes some fancy sensor fusion algorithms, and will always be prone to drift, but then reconstructing the path is possible:
I last looked at this stuff years ago, so it is quite possible that things have improved since then and some phones do more of this processing on boad, so it might be easier now to retrieve actual position/orientation data from the IMU.
that might not be possible the way you wish, gravity is not changing in an object which is falling all over the place, at least not so much that your mobile might detect it. sure there is a slight difference when you stand on top of mount everest or in the mariana trench. rotation yes but not the curve where it falls down to the ground… if am not fully mistaken.
You don’t need to be able to detect variations in gravitational strength to reconstruct the path - theoretically it is possible by combining the data from the gyro and accelerometer (which the videos I linked above show).
In practise it will always become inaccurate over time (see Dead reckoning - Wikipedia and this explanation), which is why motion tracking usually relies on some fixed reference points.
i assume the reason for it to be inaccurate is because the path is calculated from all the values, rather than measured. i assume further that measuring might need some photometric data. i did not read through that yet, it might just say that.
For creating a 3d curve representing the trajectory of a kitesurfer during a jump accuracy of height is most important.
The error over 5 to 20seconds might not be significant.
Exactly. Without reference points you have to do a double integration and any small errors in measurement quickly compound. For example, if we know from the acc. data that there was a brief acceleration in a diagonally upwards/horizontal direction, followed by a period of no acceleration, we can integrate acceleration to get velocity, and integrate that to get the parabolic curve it followed under free-fall.
I guess if you can make some assumptions about the motion there can be ways to correct for some of the drift (eg if we know the surfer hasn’t experienced any vertical acceleration other than gravity for a while, they’re probably at sea level rather than hovering somewhere above it).
In my freshman physics lab, one of the experiments involved using an accelerometer that was comprised of a water-filled, glass tube with a bubble inside. The tube was bent into an arc of radius, say 30 cm and a strip of paper marked the angular location of the bubble relative to the center of the arc. We were instructed to take a school bus and hold the tube so the plane of the arc was normal to the ground. Every few seconds we were to record the location of the bubble, which would shift, as a combination of gravity and the acceleration of the bus. From this, the instantaneous acceleration of the bus could be determined. After the results had been compiled they were fed into a program that would that would integrate the acceleration data twice to result in a distance-traveled graph. Among every team, it was a laughable, resounding failure that had many people going backwards, maybe because of the bus braking. Knowing that it was probably doomed from the start, I still wonder what the whole purpose was in assigning it.
I might be reading that description wrong, but it sounds like maybe a lot of the work is done for you already with the ‘linear acceleration’. If it is already the acceleration reoriented from the phone’s frame to world coordinates then I think you just need to integrate these values twice to get the position of the phone over time.
You could test this by starting with the phone flat on a table, screen up, then move it up suddenly (keeping the orientation) and slowly put it back down. Then turn the phone over so it is screen down and repeat. See if the surge of acceleration in the measurements is in the same direction each time.
OK I will check that later tonight and also ask the developer as he is fast to respond to emails.
I understand what “integrate” means from doing maths at school… As in find the integral of a function of x, but I don’t understand how I would integrate the raw data that I have.
The points plotted in your example integrate.gh is interedting… It shows me swinging the phone and throwing it but I thought the trajectory would have been more curved.
I’ll experiment with high and low throws and see what happens to the curve.
I just tried the app on my phone and the linear acceleration looks to me like it’s relative to the phone’s orientation.
If I hold the phone in portrait orientation and move it to my left and right it shows as acceleration in X, but if I turn the phone into landscape and move it to my left and right it shows as Y acceleration.