Hi, I’m trying to replicate a 2D wave graph but it’s impossible, any idea how to do it?
I want to have this in grasshopper to use only the curves.
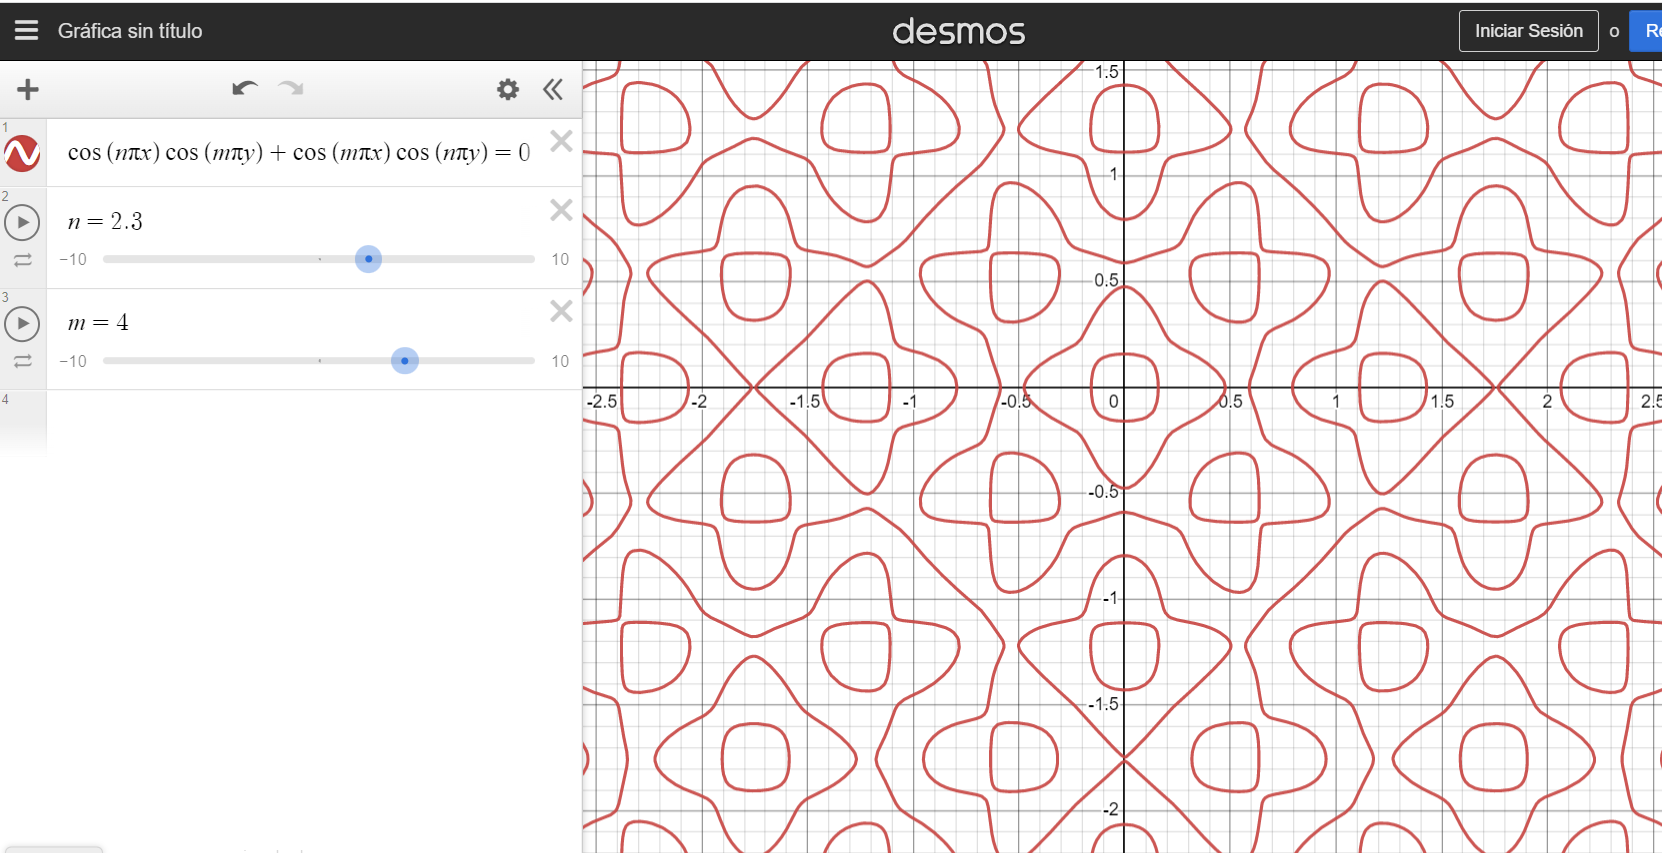
Those curves are where the function of x and y is equal to zero.
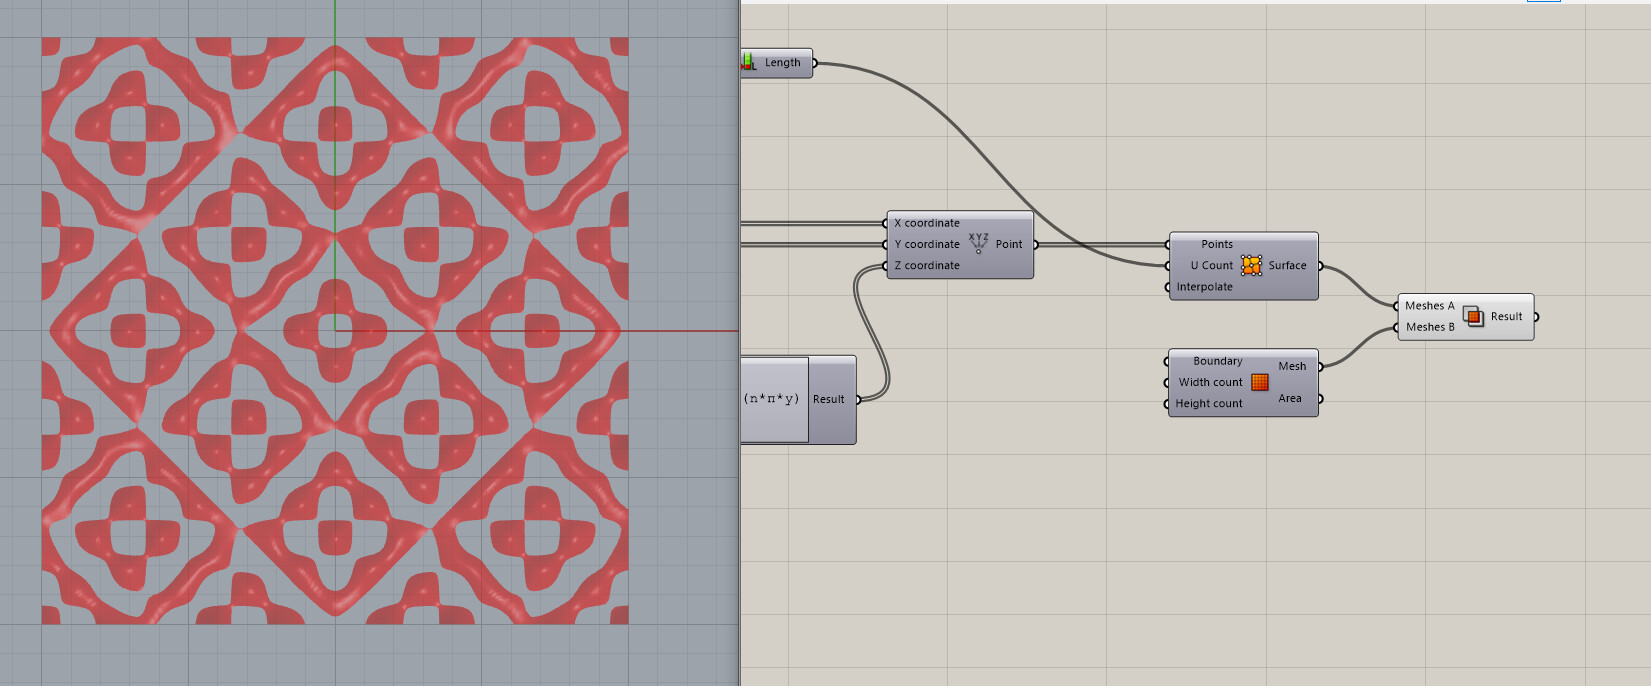
One way to plot these kind of curves in Grasshopper is to make a dense square mesh, move each of the vertices vertically by the value of the function at that point, then intersect it with a plane.
I have managed to make the 3D of the graph but I cannot convert this 3D to a 2D to obtain the curves, maybe you can send me a screenshot of how
I just start using grasshopper
I have done this a couple of years back. I’ll try to find my gh file and I’ll upload it.
Anyway I remember using a method very similar to what @DanielPiker is suggesting - intersecting a mesh with a plane.
1 Like
The thing is that I dont have much experience in grasshopper, so I dont really know how to do it.
I have this


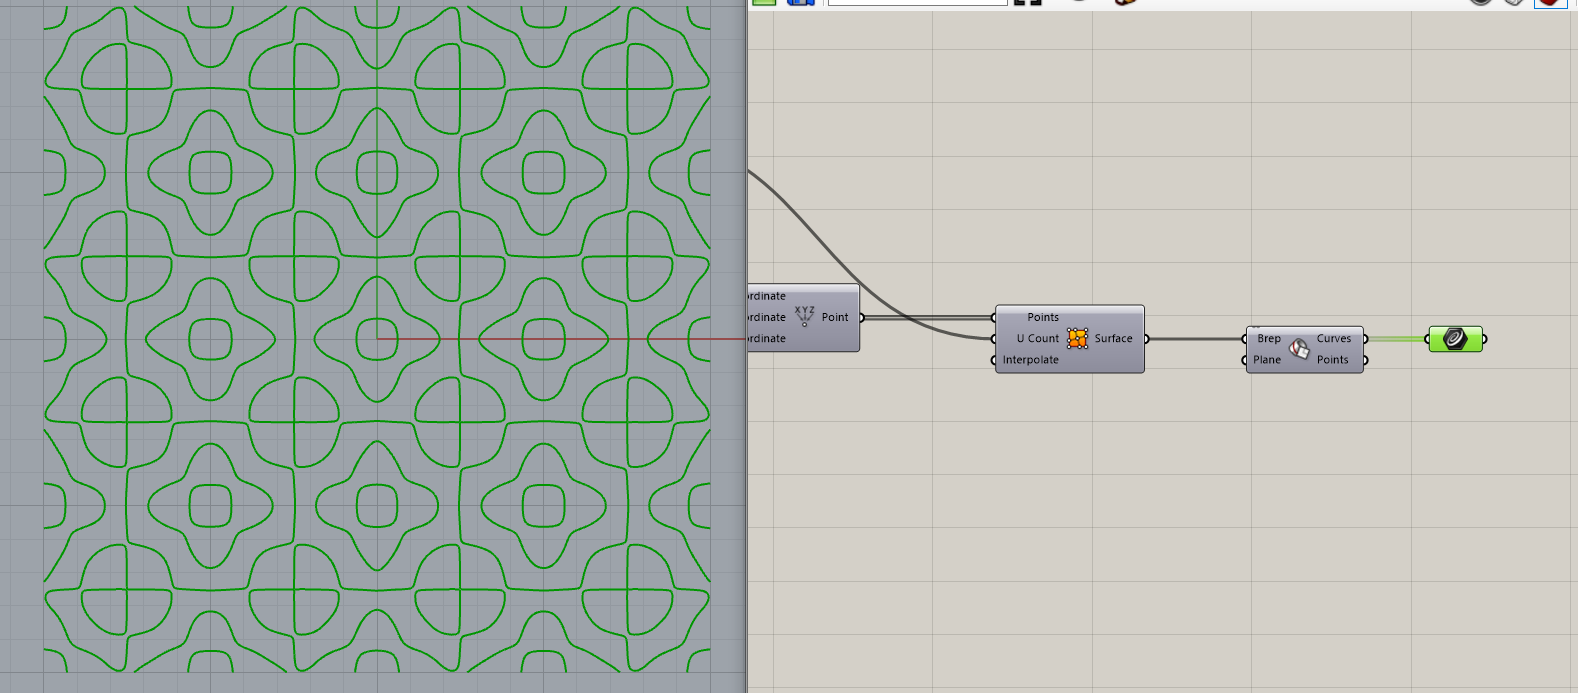
Looks like you’re almost there.
Use the Brep | Plane intersection component (with an XY plane as the plane input) instead of Mesh | Mesh and you’ll get curves out.

But I dont have a plane imput, I have a mesh of points
how can I create this plane imput
It looks like the Brep plane intersection component actually sets ‘World XY’ as the input by default when none is provided, so for the intersection at Z=0, you don’t need to change anything.
If you wanted to see contours at different heights you could use the ‘XY Plane’ component and ‘Move’ it with a ‘UnitZ’ vector with a slider input to vary the height.
The small imperfections of the contours around the saddle points are hard to avoid with this technique. Using a mesh from the points instead of a surface will give a slightly less wobbly result, but it still won’t give perfect crossings.
Thank you very much, I have been 2 days trying this.
1 Like