Aviary provides a formatting platform on top of Grasshopper 3D. From formatting layouts, to graphing data, through converting curves to illustrations, capturing 3d geometry, and even manipulating bitmaps the goal of the project is create a workspace which extends the parametric framework of grasshopper into the graphics and composition.
The projects is under development and the work in progress version is available for download at:
I’ve integrated a preliminary version of an SVG writer to Aviary which I hope opens up some new workflows for everyone. Though I have several ideas for more efficient versions in the future, any feedback would be great.
There is a new SVG folder in the sample downloads at Food4Rhino which includes several ways of working with geometry, effects, grouping/ layering, and basic animation.
A list of the new updates can be found at the GH Group (still trying to figure out Discourse vs. the old Forum):
Please
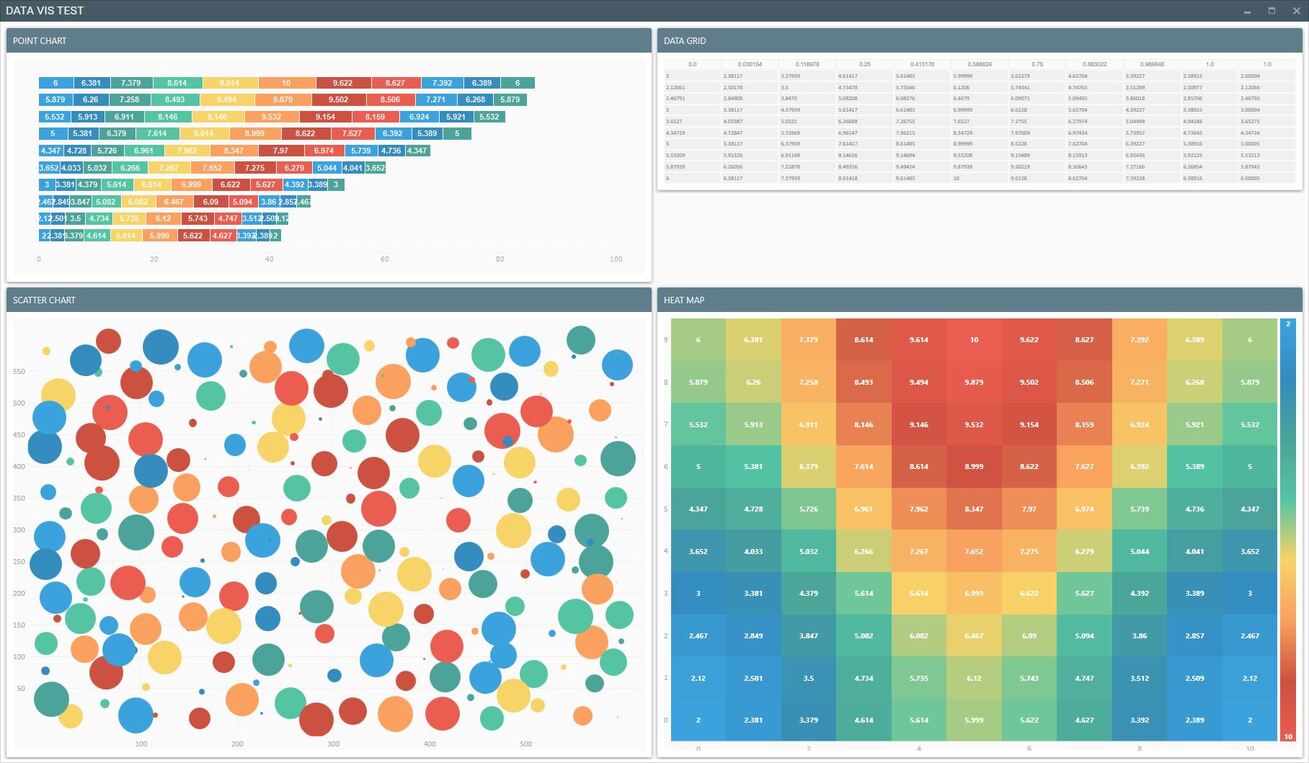
Data Visualization Preview
A quick preview of a few of the Data Visualization Chart types available in the next release of Aviary coming soon. Most of the remaining work is in standarding the appearance between the two charting dependencies. LiveCharts and Winform Charts. Charting types will include.
Winform Charts 2D & 3D:
- Point, Bar, Column, Line, Step Line, Spline, Area, Spline Area
- Pyramid, Funnel
- Range*
Winform Charts 2D:
- Pie, Donut, Polar, Radar
Live Charts:
- Scatter, Heat, Gauge, Gantt
WPF Tables:
- Fast Data Grid, Data Table
note: These chart and table components will also be compatible with Excel, Word, and Powerpoint interoperability in a later release
Preview of default graphics match for Bar, Scatter, and Heat Chart with a distinct look for the Data Grid Preview
Preview of the 3D Mode for the Point Series Charts

The 8 Point Series charts in Stack mode

The 8 Point Series charts in Default mode

The 8 Point Series charts in Stack100 mode

Hi is it posible to change the color of the background, and remove the titlebar from the window?
Each Chart is shown in a “Card” then placed in the window.
However, all Controls including Charts can just be placed directly into the window which removes the border.
Background and Foreground colors can be changed on nearly all controls including Charts.
For windows, the background color can be changed, and I can add an option to remove the title bar from the window level. Closing, etc. will have to be done from the title bar.

Hi, that would be nice, lately I been scripting some components for UI design, I suppose Aviary is base on WPF?, at least for me Aviary is the best plugin for UI right now, because of editability of the controls, have you think on developing components for Custom Controls creation?
Yep, its in the backlog, but pretty far down the line.
On a side note, this same concept of custom user inputs will be implemented for SVG, D3, and three.js outputs as well. The idea being that each element, geometry, material, lights, etc… can be written in each language and outputted as a pre formatted object that can woven into a larger scene.
Similar to a string builder into a user defined code block.
The Window control now features the ability to toggle the following visualization controls from the component right click:
- Transparency (0-255) note: Not compatible with the Winform charts, will develop alternate version.
- Controls (Minimize, Maximize, Restore)
- TitleBar
- Shadows
- Scroll Vertical
- Scroll Horizontal
This preview is with a transparent background and Titlebar turned off.


David, you make a beautiful plugin. Here an SVG generated with your plugin.

from
I didn’t try too much to put it in dropbox
Indeed, this looks great. Thanks so much for the effort David!
Laurent/ Anders,
Thank you, I hope the plugin is fun to play with.
Please let me know any pain points, things you would like to work differently.
The next version after the Data Visualization will focus on updating 3D Visualization. Preliminary tests with THREE.js are promising.
I took a quick pass at playing with some effects on the svg you uploaded by:
- Bring into Illustrator
- Convert to AI
- Import AI into Rhino
- Load Curves into GH
- See attached Sample


Version (1.00.10) Uploaded to Food for Rhino.
Data Visualization Update
This is the first major / complete update to the Data Visualization section.
- Updated all Data Table
- Updated all Charts
- Updated all Data Visualization Graphics
- Added Transparency and Visual controls for windows
The update to Food4Rhino includes the latest version of the plugin as well as updated example files.
Please use this discourse thread to raise any issues that come up.
Chart Type Showcase

Visual Grid Test

_Custom Graphics _

Note: This build does break several previous components, in particular the Window component. I am doing my best to reduce this, but in some scenarios it is unavoidable to continue to improve the toolkit.
As these are all pre releases, please know that many older files will be broken when updating to the new version.
A quick update.
There was an error with the Write Bitmap component in 1.00.10 which has been fixed in a new update.
Please download version 1.00.11
First test writing to Three.js.
Using a Normal material and ambient lighting.

Test

Hi, David, I been trying to retrieve data from the controllers but the return values component seems to through an error, the Color Canvas Component is throunghing a similar error, I believe there are other components with the same problem, they all relate to the Xceed.Wpf.Toolkit.dll.
So I substituted the original dll with one I found here https://github.com/xceedsoftware/wpftoolkit. It didn’t work, I was wondering if you know what can be cause of the problem and how to solve it?. Thanks

Antonio,
The xceedwpf toolkit has to be the specific one included with Aviary.
(make sure its unblocked to cover the most basic)
Do you have Human UI installed?
If you do, make sure it is the most current version.
Both Human UI and Aviary use xceedwpf and depending on which gets loaded into grasshopper first some errors will crop up. I
If you have the latest Aviary and Human UI installed, this might solve the issue.
If not, let me know and I’ll dig deeper.
Yes, I install the new version of Human UI and it fix the problem, thanks for the quick answer