Please Help - Points in Brep

Hello my name is Rene and I am a second year Architecture student. For this semester we’ve been thrown into the deep end with learning a new program with minimal learning material and I need all the help I can get.

I have to model up an existing building parametrically (my interpretation of it’s geometry). My building has columns and when I used a grid to generate my columns, the top edge and right-hand edge of columns on my surface is overhanging. I asked my tutors and the only answer they gave me was “Look at point in brep”.

If someone can please explain this phrase to me or provide me with some guidance on to fix this on my model, I would greatly appreciate it.

Capture
Columns over surface edge

Hi @Rene_Heath ,

Point In Brep checks if a point fall within a Brep geometry. It’s typically used more for point inclusion testing and isn’t needed for this exercise.

Columns are typically created from center points at intersecting grid lines aka the origin point for a column is typically the center of the shape where as yours are the lower left corner.

This is because of this portion of your script:

image

-a positive XY size value will create the rectangle in an X+ and Y+ direction (up and right from the start point)
image

-a negative XY size value will have the origin at the upper right corner of the rectangle
image

-a domain value such as -1 To 1 will make the rectangle centered on the origin point.

-I would use a construct domain component with a simple -x*.5 and x*.5 expression in the A and B inputs to ensure that your overall column width remains 1. Since you are now going from -1 To 1 that is a “distance” of 2.

image

Here’s an example showing how you could apply the domain logic to a uniform column grid.
The idea with this example that you would establish a column grid and then create your building profiles so that the floors generally fall on said grid.

Alternatively, you create any shape you want and subdivide/divide it as needed for your grid spacing but for this exercise I think the first is more clear?

Graph Space:

Model Space:

I’ve also added this little bit of logic so you can preview the data tree structure which, in this case, is organized per column “V” row:

I hope this helps! All the best on your architecture journey!

20230915_Column_Grid_Response_01a.gh (14.9 KB)

Than you Michael

I will give it a go and let you now how I went.

1 Like

Hello @michaelvollrath , Thank you for helping me out.

Sorry to bother you again but I was wondering if you can help me with a new issue that arise.
The Building I am modelling up needs to fit inside this footprint (see attached jpeg- Establishing a Grid). I could not quite figure our your grasshopper file as it required me to have a curve and I do not have one. I did however find your first method easy to follow and it managed to fix my issue. Thank you for that.

In return, the scale of the building was enlarged by 0.5. I was wondering if there was a way for me to resize the entire structure using the original footprint boundary/points/polyline?


Grasshopper Model_Help.gh (1.1 MB)

Hi @Rene_Heath ,

I’m not exactly following you. Do you mean you’re trying to extrapolate your logic to cover the lighter pink shape as well, in other words, give it floor slabs, columns, etc?

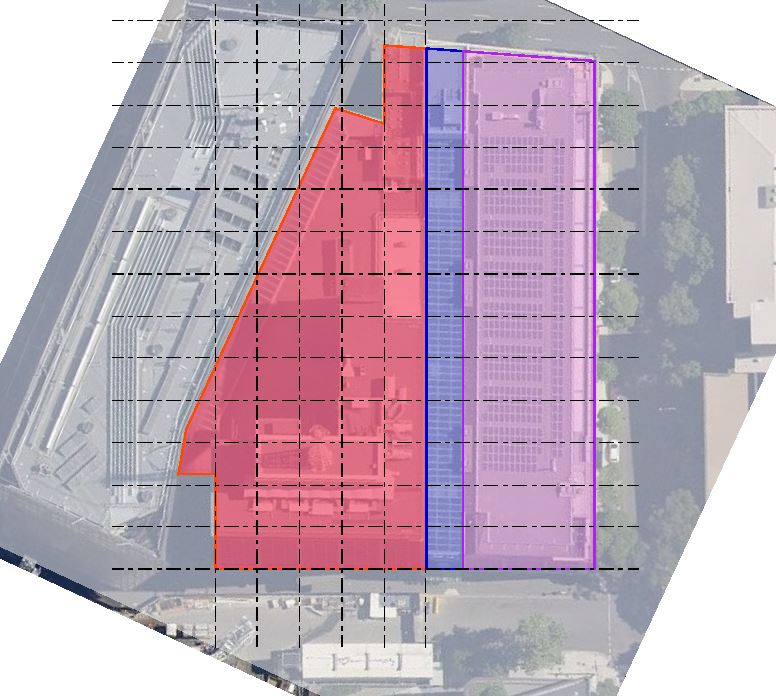
I’m referencing building A in this diagram.

Regarding scaling. If you know everything is scaled by .5 then just use the scale component to scale the satellite image and grid lines you’ve established and anything in your grasshopper script that needs to be scaled.

Or you can scale at the very end of your script but I’m not sure why you wouldn’t want to just set the right scale at the very beginning.

Also the polyline you create with your original points is clockwise which, while this seems intuitive, in Rhino/GH means it is actually flipped/upside down.

You can see this when you create your Surface Frames in your “Create Columns” group. The Z axis are pointing downward.

To simplify things later on. I would reorder your polyline points to generate the building profile in a counter-clockwise orientation, ensuring downstream logic will be “pointing up” or Z Positive.

You can also use the Domain box component in your Create Columns group to replace the combination of Rectangle, Boundary Surfaces, and Extrude components.

Do you really have to define the building footprint with point2D coordinates?

This seems like a difficult way to do it. My original script defined the building footprint with a referenced curve from the Rhino model. You would simply draw the building boundary in Rhino, reference it into Grasshopper, and the logic would flow from there.

You also only need 2 of your points to define a rectangle FYI:

image

These are just observations… feel free to pick n choose as needed of course

Let me know your thoughts/goals,

Thanks!

Thank you for your help. I will take on your suggestions. The components for the column generation is a much better alternative.
And yes, unfortunately we have to do this whole assignment in Grasshopper as we only submit the grasshopper file and assessment states no modelling can be done in rhino.

Thank you again