Using the new curve option for Point Deviation, I noticed that the evaluation does not update when manipulating the input curve. Is that intended?
Furthermore I would like to propose adding visible Min And Max indicators to the tool. That way the tool could also be used to take actual measurements!
The points test statistics even show a Maximum Deviation. But only after closing the tool. Having that in real time would be great help for us CV pushers!
I get about the max and min dots at the appropriate locations - we can look at adding that but the max and min should be updating as you go, in the panel…
I tried again today and found that the analysis does indeed not update when manipulating the curve. Strangely it does update when moving the surface! I tried some variations, like a planar surface and a circle, to see if that makes a difference, but was still the same.
Hello - the curve that gets sampled for points does not update - what happens is, you pick say one curve, that you want to edit, and one that you want to check against. The second curve is sampled for points - these are then static, and are measured against the first curve, the one that you edit. Monkeying with that curve should update as you go - do you see that?
I’m sorry I do not understand what you mean. Where does the second curve come from?
I am probably using the tool in a wrong way, but what I’m trying do is manipulating a (blend) curve to match as closely as possible to the big vertical fillet (in the pic above), then using the new TrimRefit command, I build a linear matched corner fillet. That is the standard Class-A way of filleting. It is the most reliable method of approximating that big fillet surface, while still using a single span curve for a clean linear match.
Hello - whatever you are measuring against just provides points - - in the example, you’d need to get the points from the surface (render mesh) or get them from an extracted isocurve of that vertical fillet. The curve you are manipulating then is measured against those points, if you see what I mean.
Yes I understand that. I picked the curve first and then the surface to measure against.
I understand the tool this way: The preset number of points are generated on the first curve. Those points are then projected in normal direction onto the object I want to measure against, and those two sets of points are what actually gets measured. Each point against its projected counterpart. Is that right?
I think the missing bit is that the points are static - they do not travel with the geometry that provides them, so you cannot get them from the curve you want to edit. Does that make sense? I see what you are getting at and I see how that could be a good thing but it does not work that way now.
Now I understand. However the logic behind that tool having two sets of points, one static and one dynamic, is already there, it obviously works. Couldn’t this just be swapped? Not being able to use the tool that way keeps Rhino from having high quality fillets unfortunately.
The problem with “correct” filleting is, that this curve never is an isocurve. Thats is why you use a blend curve and TrimRefit. That way it “becomes” an Isocurve. The parameterization of the surface is changed, but the “shape” stays the same. This way the TrimRefit Surface becomes a substitute for the original Surface. That is the whole “Trick” behind that technique.
This approach is also the reason why I was so excited about all your Fillet Enhancements and the new TrimRefit. command. It opens up a whole new chapter of surfacing possibilities.
FWIW, what I do is get my blend pretty close, Pull it to the surface and then use the resulting curve as the point-provider, if it is not an iso… when the fillet has the same structure - degree 5/6 say, then it’s point distribution is of course a good indication of where to put the blend curve points.
Yes I see. But that way you get a curve that sits perfecty on the surface underneath, but will likely have tangent deviation. Using the Point distribution of the surface as an indicator is the the right way btw!
The problem is that you need the"green" curve to get the “green” curve.
And without measurements to keep everything within tolerance, we are running in circles.
The trick to Class-A surfacing is that everything always gets measured. All those little tools are used in conjunction with each other.
Unfortunatly Rhino is missing the last 5% of those little tools that keeps it from getting 80% of the quality.
I know Rhino always gets close. The surfacing tools are great, but it is the match quality and the analysis tools that keep Rhino back in topology quality.
@Cadworx - just to see if something useful might come of it - here is a first stab at a curve >surface deviation checker. This currently does, assuming it works, the following:
Run the script:
Prompts for a curve and a surface - it then shows max and min clearance at these locations— 32 samples for now. (Negative numbers indicate it is on the ‘far’ side of the surface normal. I imagine it might be good to change dot or text colors for negatives.)
Run the script again:
Turns it all off. You’ll need to re-select to get it running again.
Eventually, assuming this is somewhat correct in real life, we can make it remember the selection, draw hairs etc.
Thank you so much Pascal, I’m so happy that you take care of this! Unfortunately I cannot test this before Monday at work …
My initial hope was to have a dedicated “Distance Analysis” in Rhino, using Curves, Edges and Surfaces interchangeably, as one tool that just returns Min and Max Distances with the only settings being the point count and the hair scale.
However thanks to you the Edge to Edge case is already covered with the Min value addition to the Edge Continuity Analysis. Now this Script covers the Curve to Surface case.
The only two cases left would be Edge to Surface Distance and Edge to Curve Distance. Could your Script be tweaked to also measure these combinations? The logic is always the same in all those cases.
Hello - yes, all that should be possible - I’ll take a look. Meantime, here is an updated script to try.
It now finds and shows the max and min locations more exactly and uses the samples to draw the lines only.
–
Curve-Curve:
Updated these and made a plug-in to make testing a bit easier - DrawCurveDeviation.rhp (48 KB)
You’ll need to unblock the rhp in its Properties, then drag and drop onto Rhino… seems to work ok here. DrawCurveSurfaceDeviation DrawCurveCurveDeviation DeviationDisplayOptions
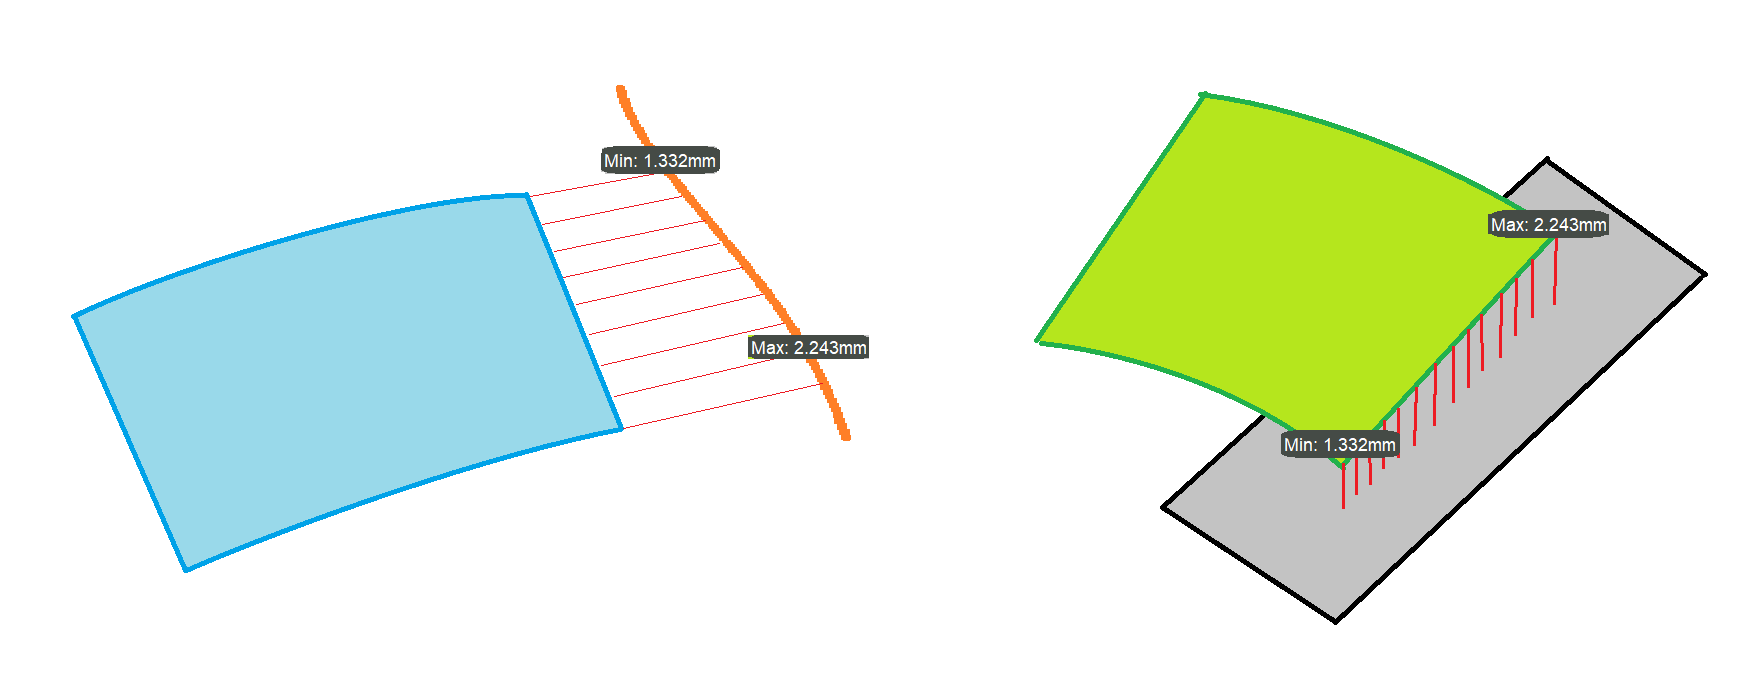
You script seems to work great! I just have a question about the drawing of the green line that indicates max deviation (which, btw, should perhaps be blue to stay consistent with the EdgeContinuity tool):
It seems to be drawn sideways in the above image? What does that indicate?