In Rhino 8, plotting from matplotlib causes a confusing flurry of windows to open over Rhino or would cause a crash. Neither case made it easy to work with this library.
Next build of Rhino WIP includes an Eto backend for matplotlib that supports showing plot windows over an application implementing Eto UI framework. It works the same on macOS and Windows.
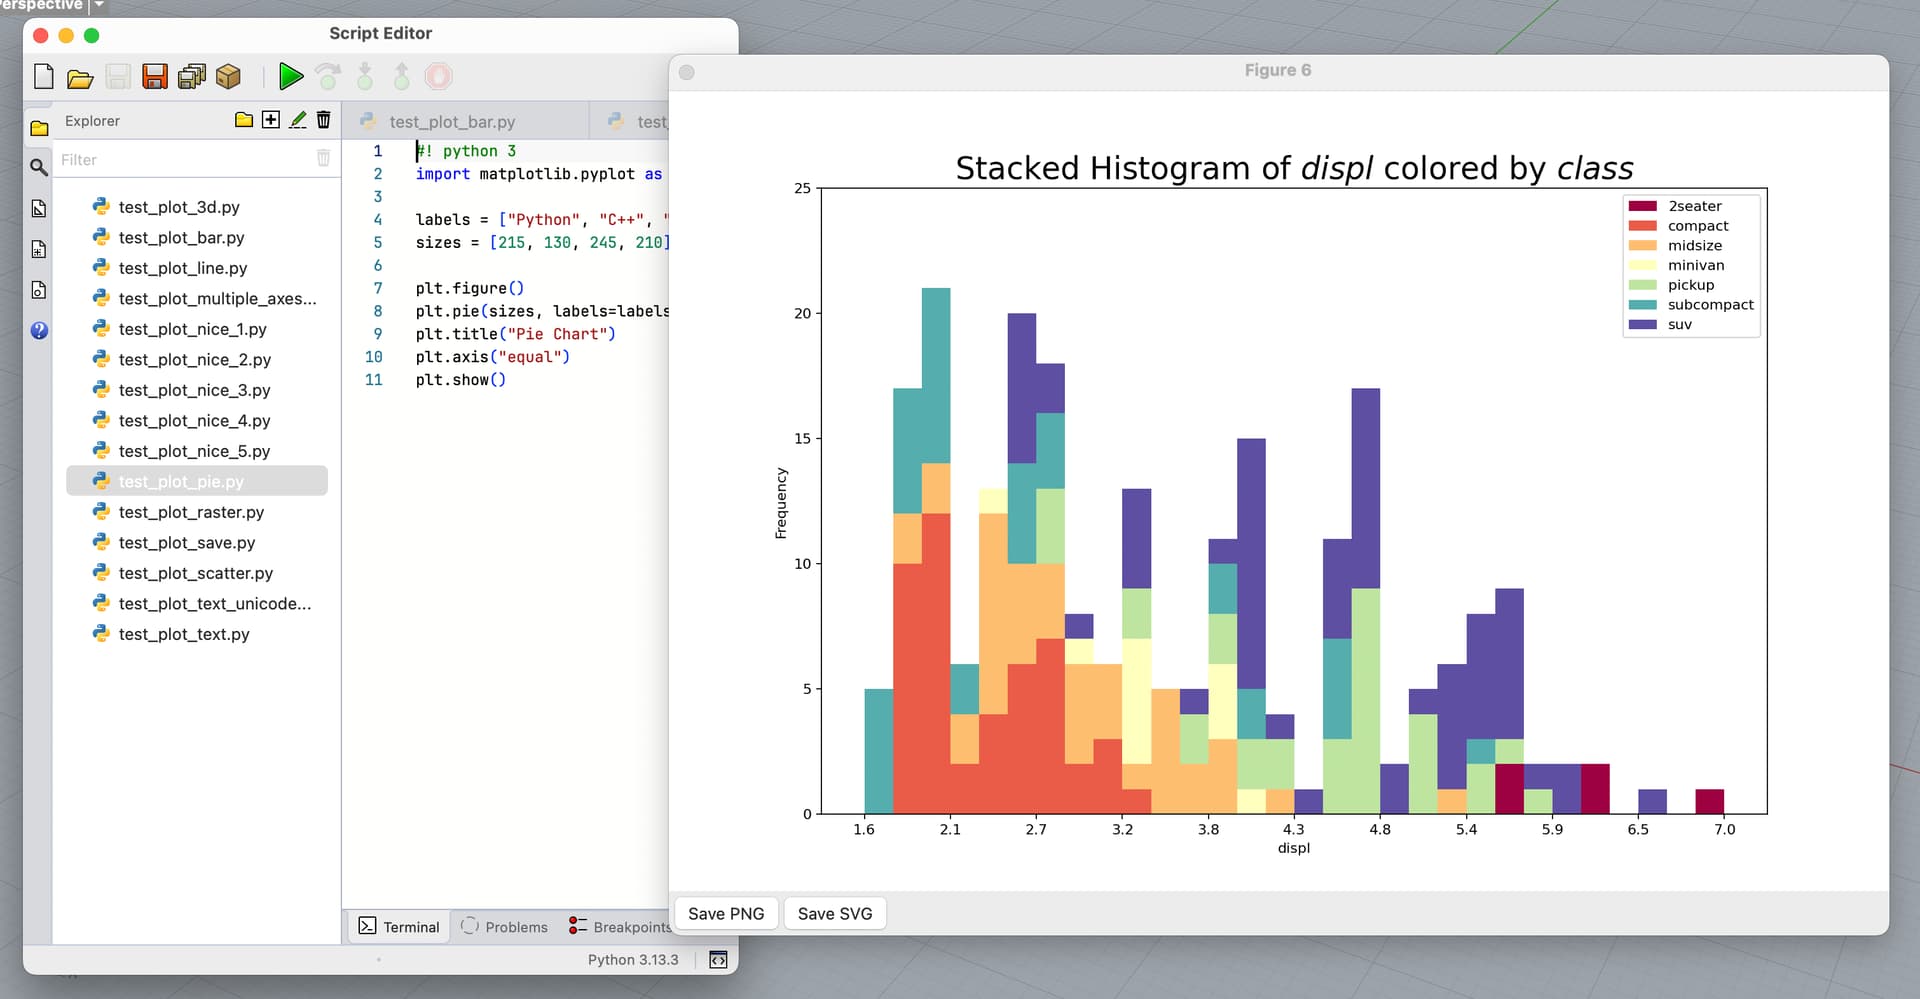
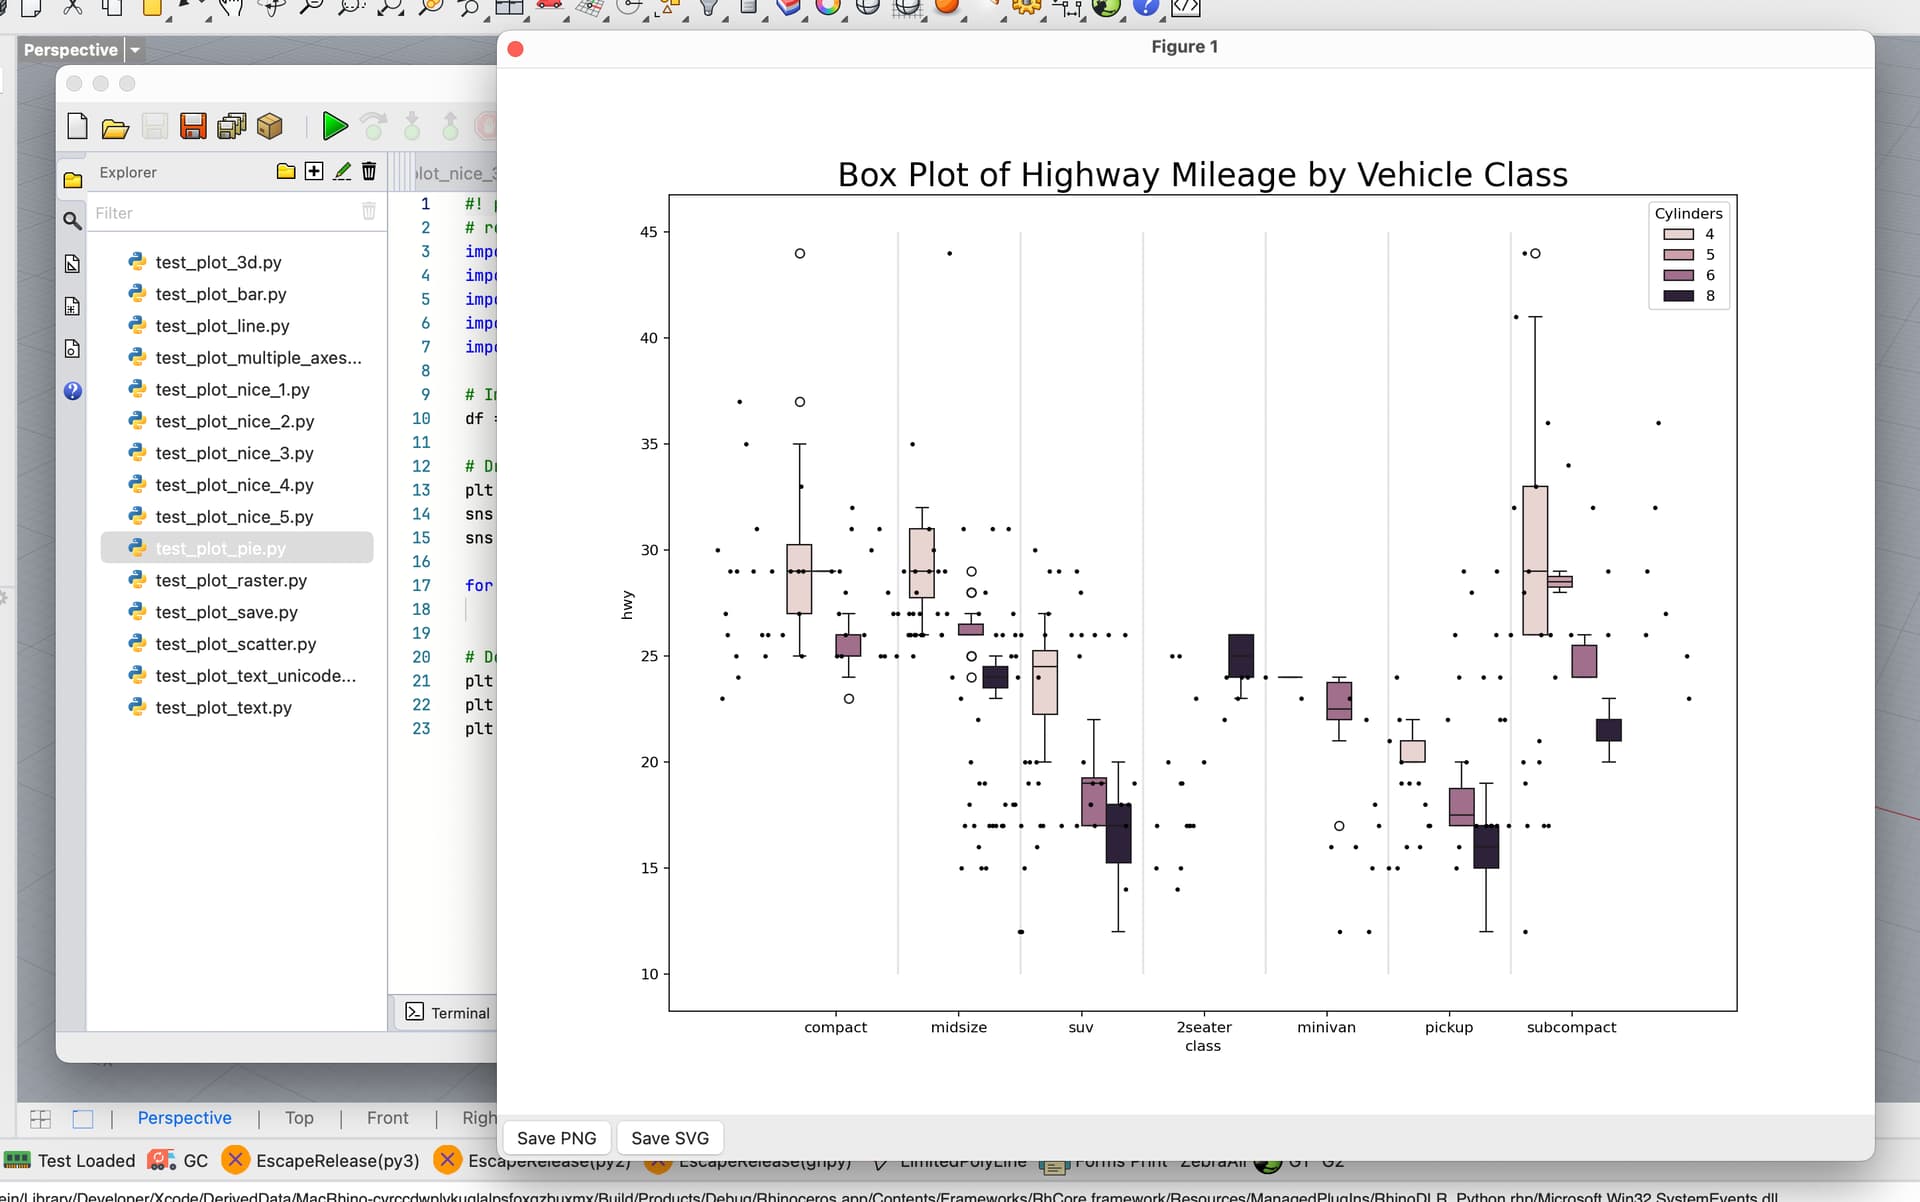
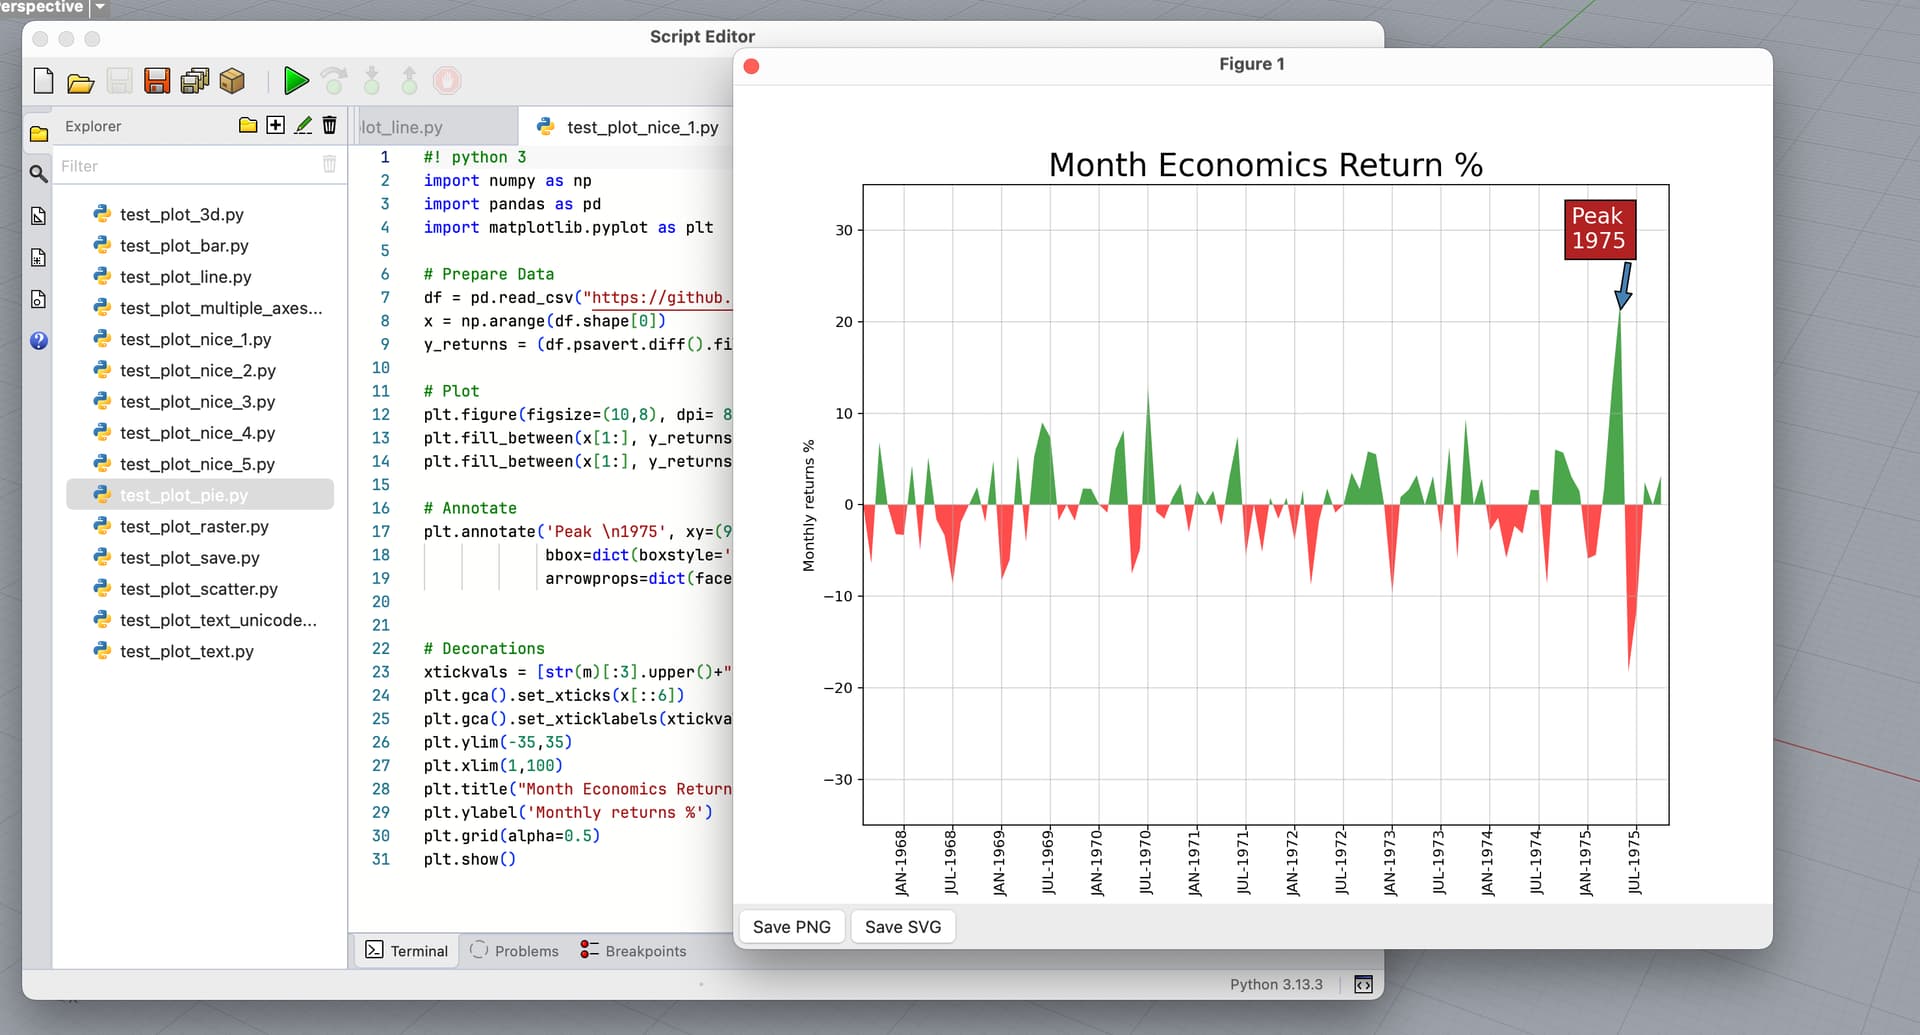
Here is how the plot window looks like. It shows up over the script editor and has buttons to export the plot to .png and .svg formats:
Assuming you do not have custom configurations for matplotlib on your system, you do not have do to anything. Rhino automatically configures matplotlib that is loaded in Rhino (See ~/.rhinocode/py313-rh9/matplotlibrc) to use this new backend.
Simply run your script and the plot should show up.
Are plots interactive?
No at the moment. Interactions requires implementing the complete matplotlib drawing API and is considerably more work. Let me know if you absolutely need interaction to work.
This is a new feature and might cause crashes in Rhino. Please save your work before testing and let me know if you see any issues or want other features.
I understand that you want to improve the confusing furry of windows, but I do not understand the improvement using the ETO backend just for matplotlib. Is there no other solution to improve the window behaviour for other bachends aswell? What about pyqt? For python developers other GUI Frameworks such as pyqt are more common to use. ETO would not be my first choice in CPython. For the future I can imagine to implement pyqt GUIs for our use cases, where interaction with Rhino is needed. I also like pyqtgraph, which has a much faster plotting engine than matplotlib. It would be great to have a nice window behaviour for this as well.
Coming back to the matplotlib ETO backend: Interactive matplotlib windows is a must for our use cases. We always open matplotlib windows to zoom in and out and have closer look at the data at a specific location. I was also playing around with a matplotlib interactive window, where I added sliders and mouse interaction, see screenshot.
There you can move the points with your mouse in matplotlib and the Rhino curve will update immediately in the background. Our aerodynamic rotor blade designer asked for such a feature in a different use case. How would this be possible with the ETO backend?
Is it possible to change the matplotlib settings to default settings, if we do not want to have the ETO backend? I only had weird window behaviour, but no crashes so far.
RE interactivity I added this YT ( RH-88376 Support Interactivity in matplotlib plots)
The file ~/py13-rh9/matplotlibrc is the configuration file for matplotlib. You can overwrite your settings here.
Would love to know more about “Weird” behaviour if you have reproducible test cases.
Slow Answers:
Almost all plotting backends (minus the ones that output bitmap or vector files) use a GUI library e.g. QT, Tkinter, etc…
These backends are NOT designed to work in an environment where an application is already loaded, had a GUI App instance with its event loop, and therefore most have problems loading inside Rhino which uses Eto as its GUI library. So the safest way to implement an output plot window in Rhino is to create a matplotlib backend and works with Eto (~/py313-rh9/site-interop/backend_eto.py)
@eirannejad for what it’s worth, I’ve just added some graphing support in DKUI using Matplotlib in GH python 3 components.
I took the easy path and got Matplotlib to give me .png files as the output, which I pipe into DKUI as b64 encoded files and render directly in the page.
I only just started fiddling around with Matplotlib this week and did the exact same (I think)! Here’s a quickie example for anyone looking to draw their plots directly within a Rhino viewport (using this code for the drawing, which could probably be combined with the CPython code). Saving the figure is a pretty substantial bottleneck (i.e plt.savefig), but it’s still sort of “interactive” here: