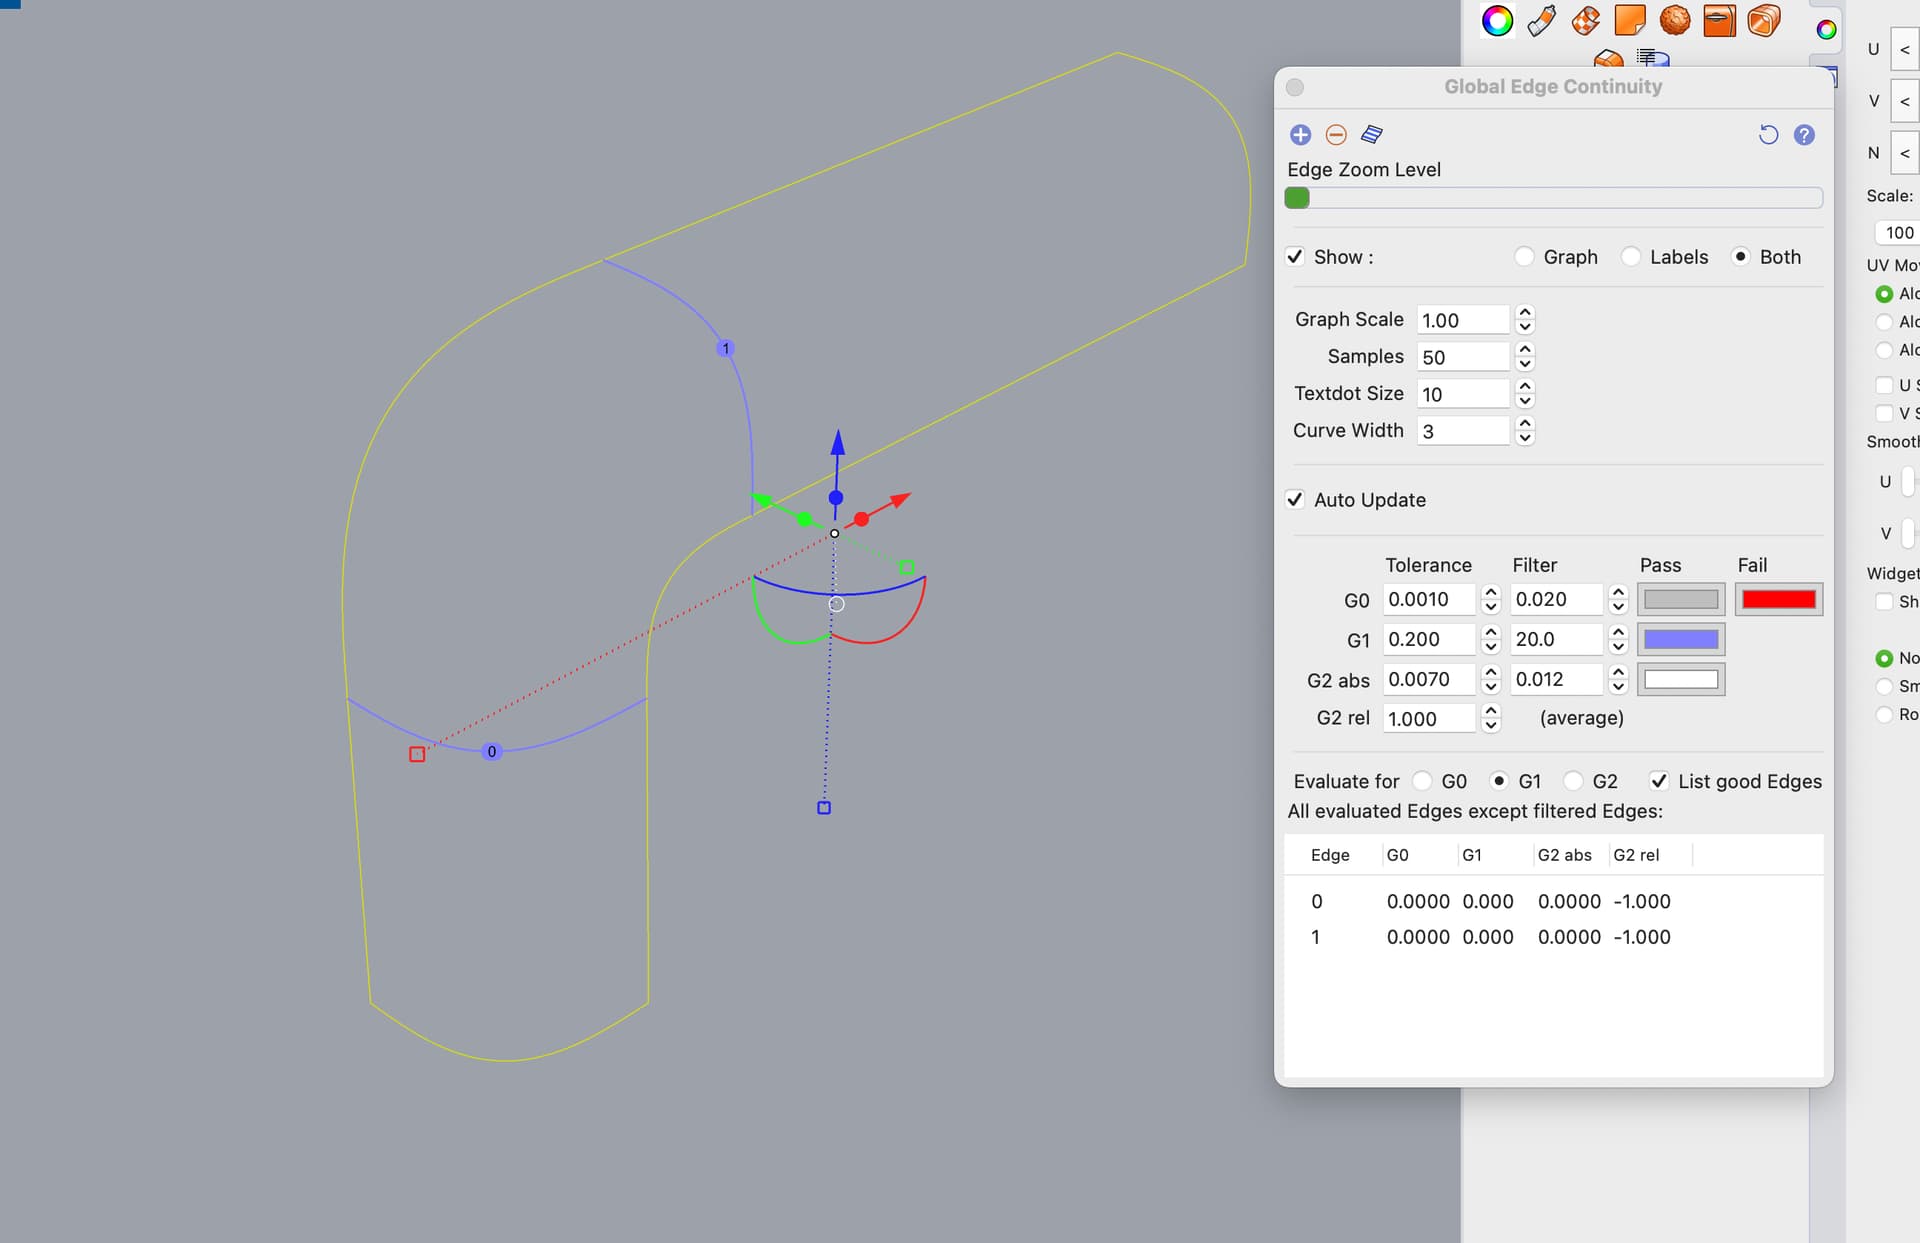
GlobalEdgeContinuity is a tool to quickly analyze the continuity (G0, G1 and G2) between surfaces.
How does it differ from the existing EdgeContinuity command?
With EdgeContinuity each edge pair needs to be selected manually. When you want to analyze a large amount of edge pairs, this can become a tedious exercise quickly. GlobalEdgeContinuity automatically finds edge pairs between the selected surfaces and give you insight in the quality of the (surface) model in one go.
How does it work?
There are two ways to analyze edge pairs:
Select a single surface and run the command. It will find all matching surfaces that surround the selected surface.
Select multiple surfaces and run the command. It will analyze all edge pairs between the selected surfaces.
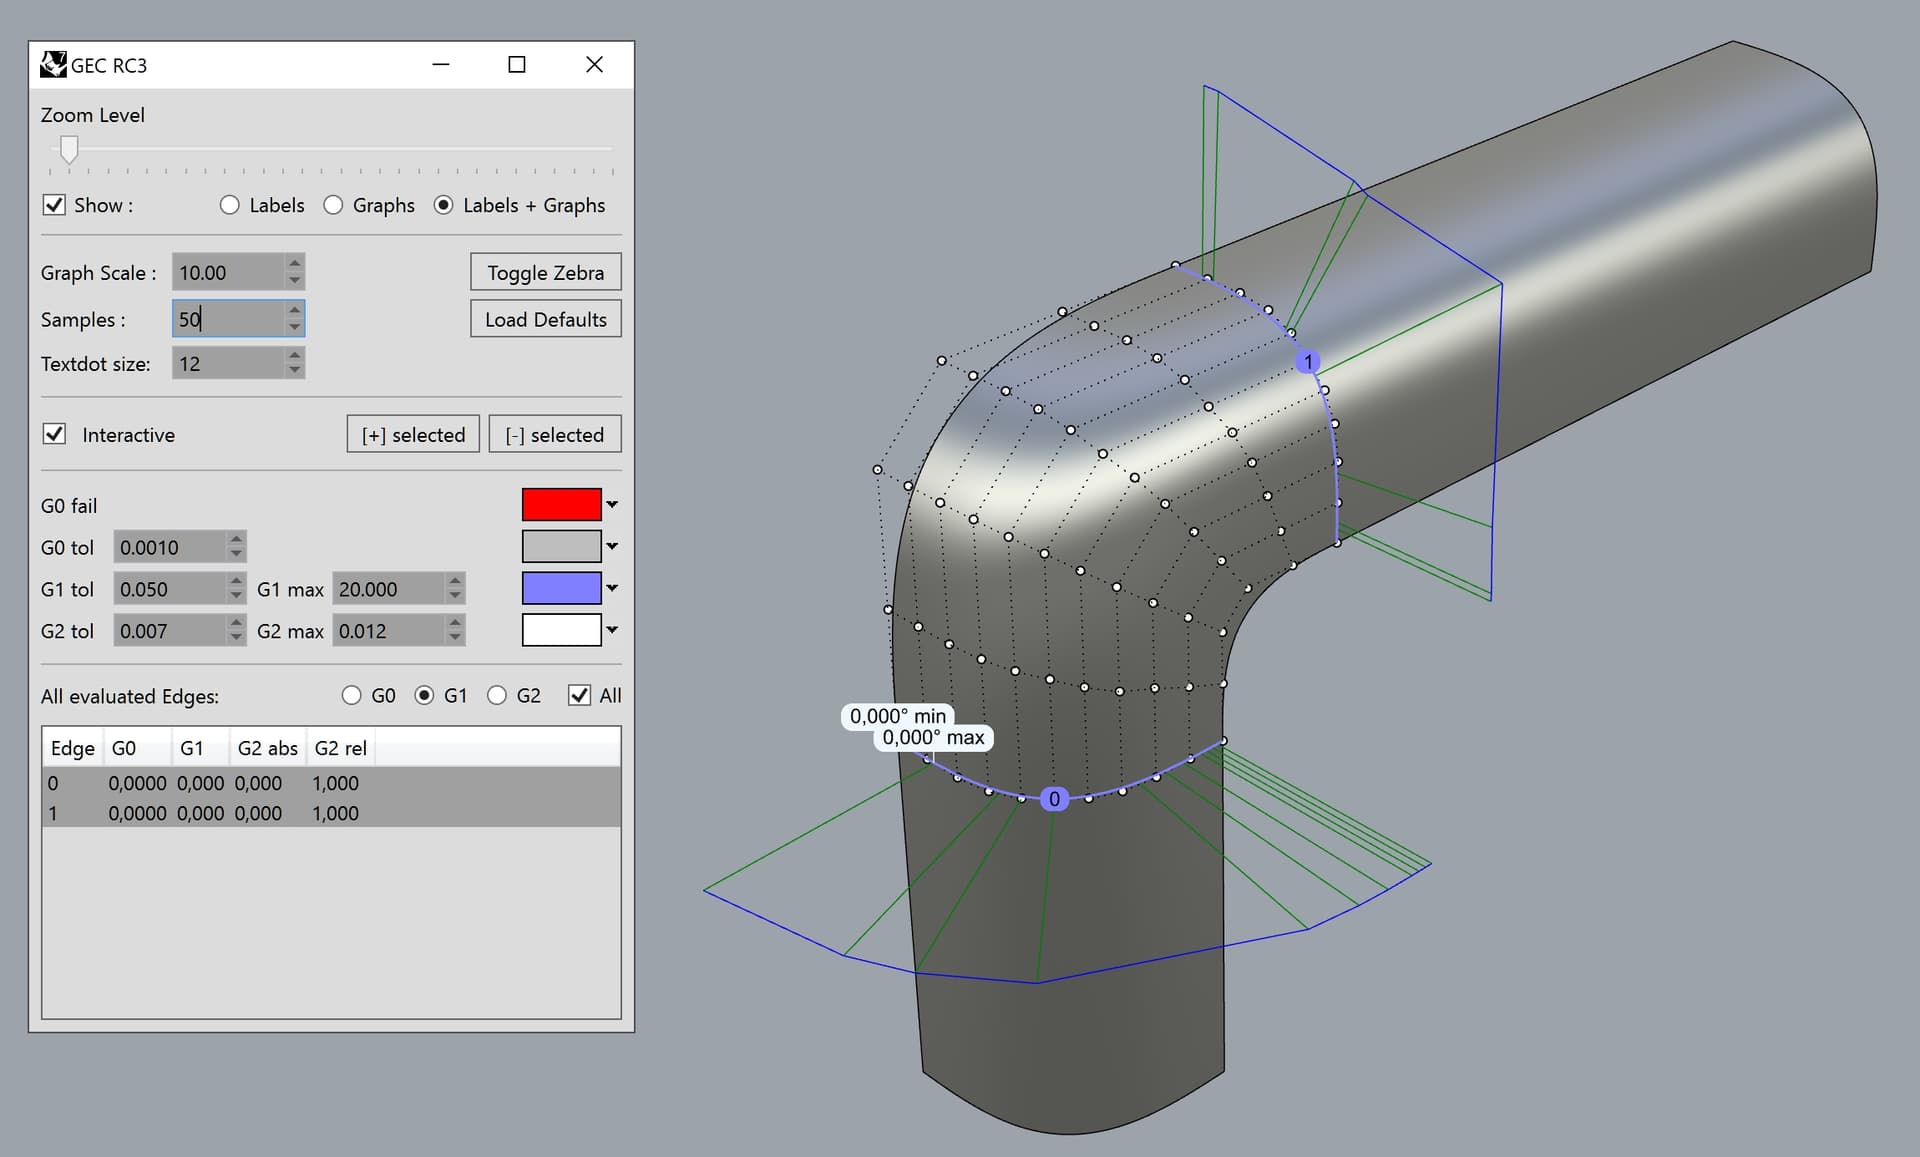
GlobalEdgeContinuity evaluates positional (G0), tangent (G1) and curvature (G2) continuity between surfaces. The feedback is both numerical as well as graphical, using edge coloring and graphs.
Is it possible to add/remove objects while their control points are visible?
Currently, in Rhino 7’s version of the tool I’m unable to add new surfaces whose control points are on, so I’m forced to turn them off, then add the surface(s) I need, then turn the control points again. This is especially inconvenient when I have multiple surfaces with visible control points and I’m forced to repeat the process of selecting them all all over again.
@Rhino_Bulgaria yes this works in Rhino 9, where I changed that behavior. Previously you could only add already selected objects, but that was changed with RH-86907 GlobalEdgeContinuity: Adding/Removing objects does not prompt
That’s great! I just had to deal again with that behaviour in Rhino 7 and can’t wait to buy Rhino 9 when it’s released! It has several meaningful upgrades that will fit my modeling workflow perfectly.
GlobalEdgeContinuity in Rhino 9 is much better than the beta version you are using, with regards to the G2 calculations. The edge matching algorithm has improved significantly as well, and should in principle not give any false negatives anymore.
I noticed that the new version also could place multiple baloons across an edge. Could the number of these be modified by the user, so that I can place, say, 10 baloons along a certain edge which I want to examine in a more detailed manner? This was discussed a few years ago in another topic, but at the time it was not possible.
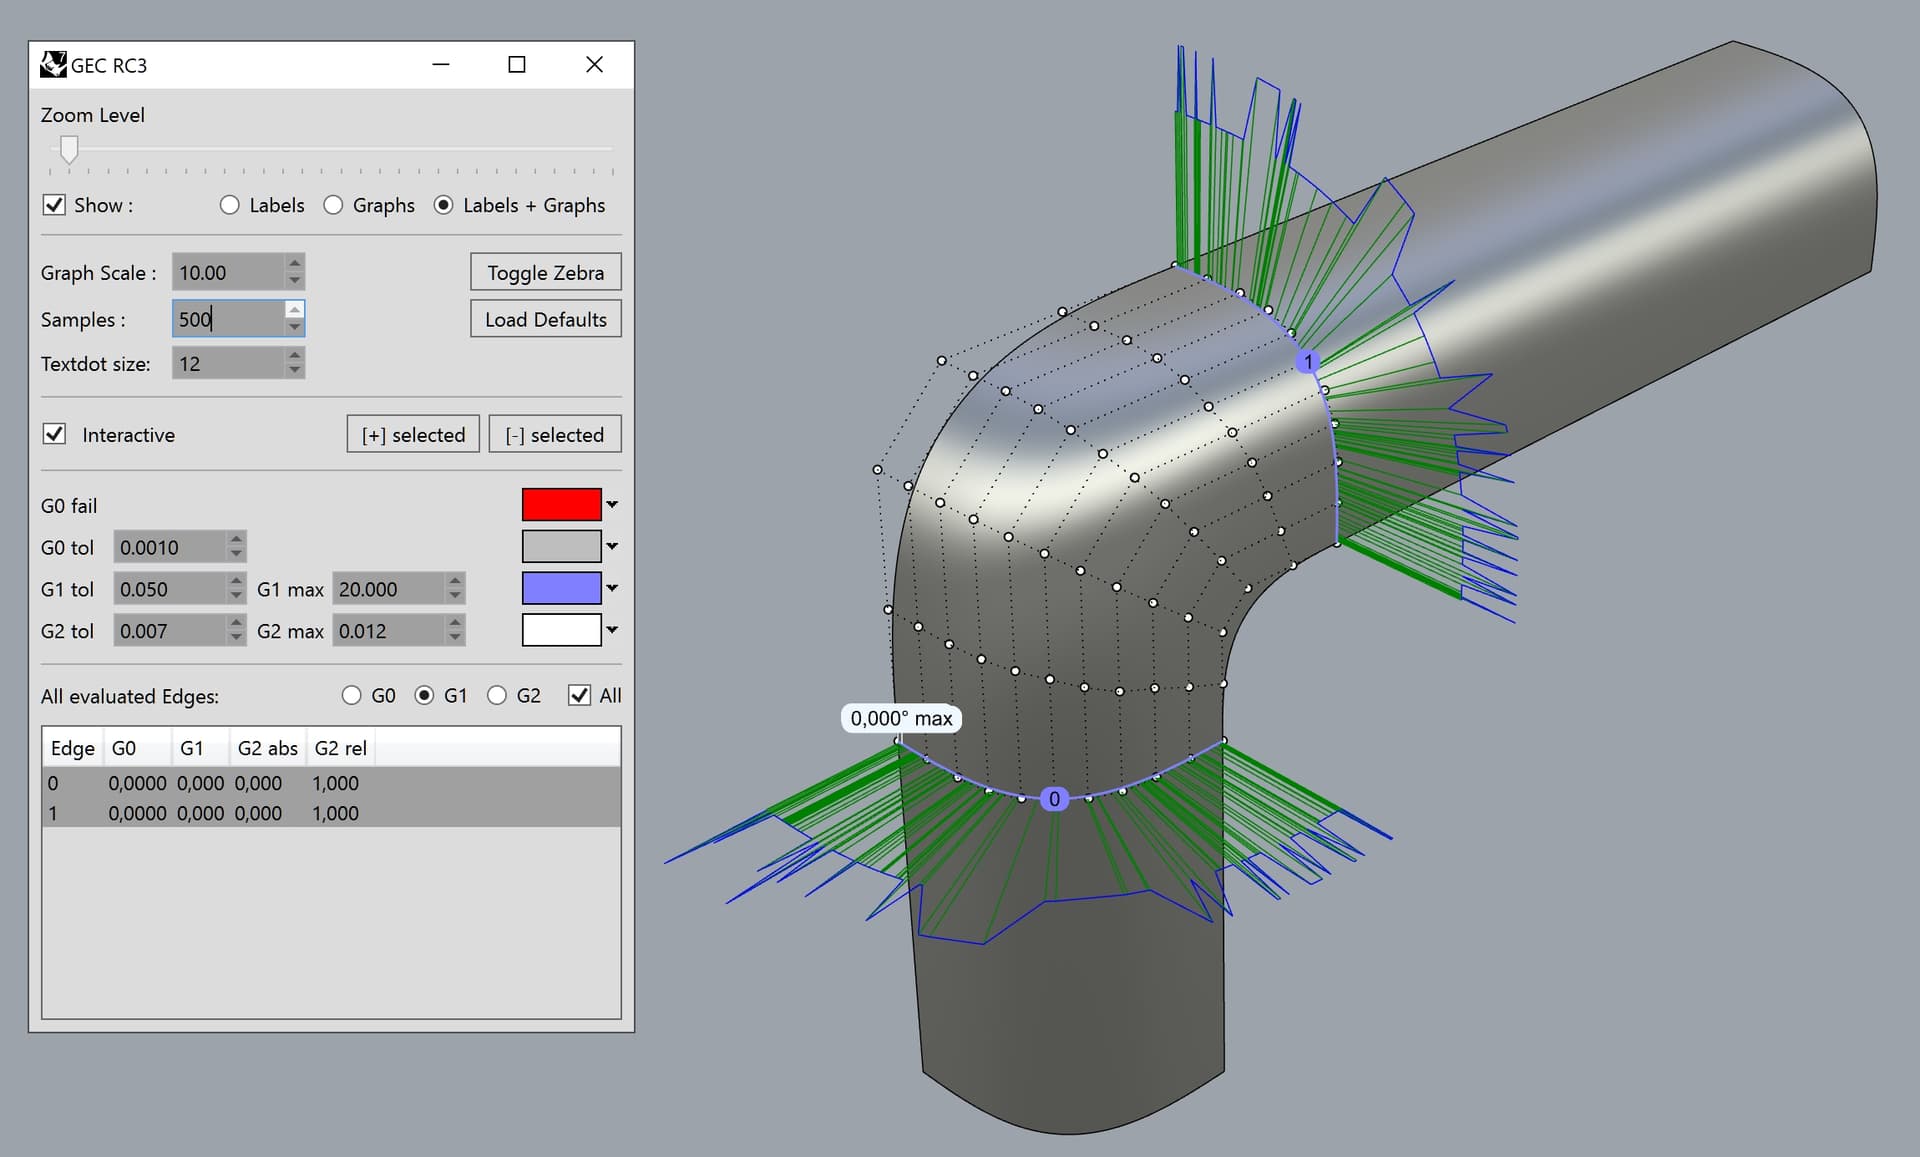
Also, can you try the new version of “Global Edge Continuity” with this file (Rhino 7) and see if it will give a better, more accurate result? I noticed that the crosshair is significantly different depending on the “Samsples” value. Create a Blend surface.3dm (498.3 KB)
The 3dm file itself is a bug report that hopefully will be fixed in Rhino 9. The two input surfaces had split edges in the middle, then I merged them again. However, “Blend surface” ignores that and creates a much more dense surface than what’s required. If I untrim the input surfaces, the blend surface is simpler.
Regarding the samples, in your original post the image shows 6 baloons and 50 samples. Does that mean that all edges will receive 6 baloons in case that I include many more edges to the list? Is it possible to have 1 baloon per edge but 10 baloons on a specific edge? Or, maybe make it relative to the length of the edge, so that longer edges will have more baloons?
Only the selected edge will show the balloons, this hasn’t changed. The amount of samples per edge determines the amount of balloons as stated. What is a long edge for you might be a short edge for another. I would have to sample based on edge length. In general I find that it is best to more or less match the amount of balloons with the amount of control points, so that the balloons are quite ‘close’ to the control points you are editing.
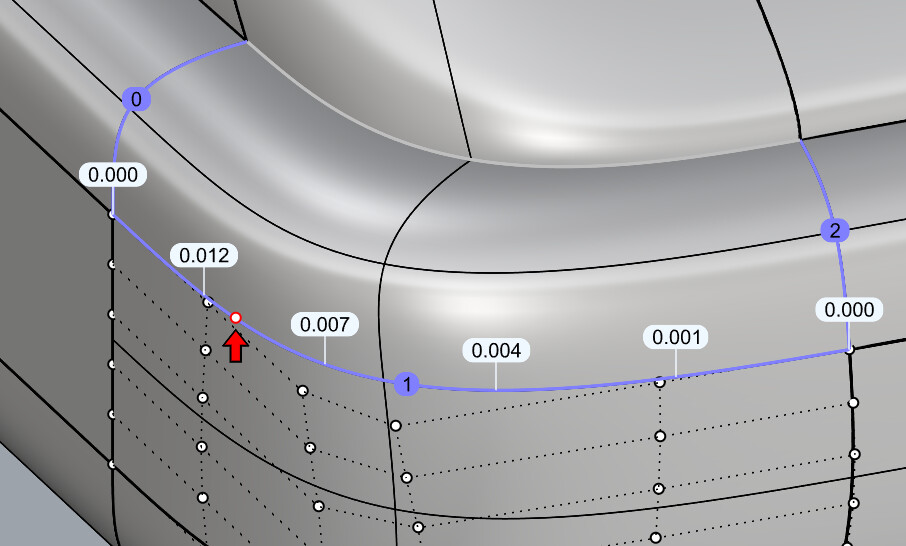
Is there a way to add an extra baloon which shows the maximum deviation, while the remaining baloons are distributed along the edge by equal distance? This way, only the maximum deviation baloon will move upon editing the control points.
I found that, with the extra indicator for max it could get in the way. I might change that and make that indicator longer and stick its head above the rest
I second that. A visible baloon with the maximum value is much needed. Solidworks makes a great use of distant baloons connected via a line to the exact point of interest, in order to not obstruct the view on the edges/fillets. I guess that 3-4 times longer vertical line to the “maximum” baloon will work perfectly fine in Rhino.
I need to figure out something else for that, since sometimes the point will be very close to an existing point. They can also be vertical when the points are on a vertical edge.
I experimented earlier with lines that rotate away from the edge, but it ended up being very jarring.
Similar baloons in Solidworks are typically connected via lones normal to the surface/edge. They can be freely moved away by the user, meaning they will be no longer normal to the surface.
I tried other solutions, but this means the balloons start jumping around as you rotate the model.
My current idea is to hide the balloon that is closest to the max. deviation one and then show the max deviation one instead, probably in a different color.
Normal direction from the edge seems like the best solution, because the balloons will be always away from the surface edges. I don’t mind having the normal lines oriented in variable directions while working on highly curved surfaces. This actually corresponds with the natural shape of the analysis comb, which is also normal to the edge pair.