First of all it seems like a super nice “plugin” with a lot of potential in landscape architecture and a wider perspective on city planning. But what is the ressource behind the data of apsorbtion for each tree?
I’ve been looking around to find some ressearch determining a number for CO2 pr tree, knowing that there’s of course a lot of different knowledge, as well as context related factors that plays a role:
We have obtained all the data from the spanish “Ministry for the Ecological Transition and the Demographic challenge”: https://www.miteco.gob.es/en/cambio-climatico/temas/mitigacion-politicas-y-medidas/calculadoras.aspx. We have built a graph for each species which relates the CO2 absorption with the age of the species based on the data provided by the ministry. This way we can interpolate the CO2 absorption from the age.
There was a problem with that species, thank you for reporting it. I have just uploaded a new version which fixes this error and adds new features: creates a graph to check how values are interpolated and it allows you to export results to a txt file. Also, the workflow to define the age of the species is now easier.
And this seems like a solid source thank you for sharing(also inside the file) And way easier to calclutate than using the trunk-diameter. Especially in the digital world / the preplanted calculations
Thank you so much for your feedback! I hope this is useful to you.
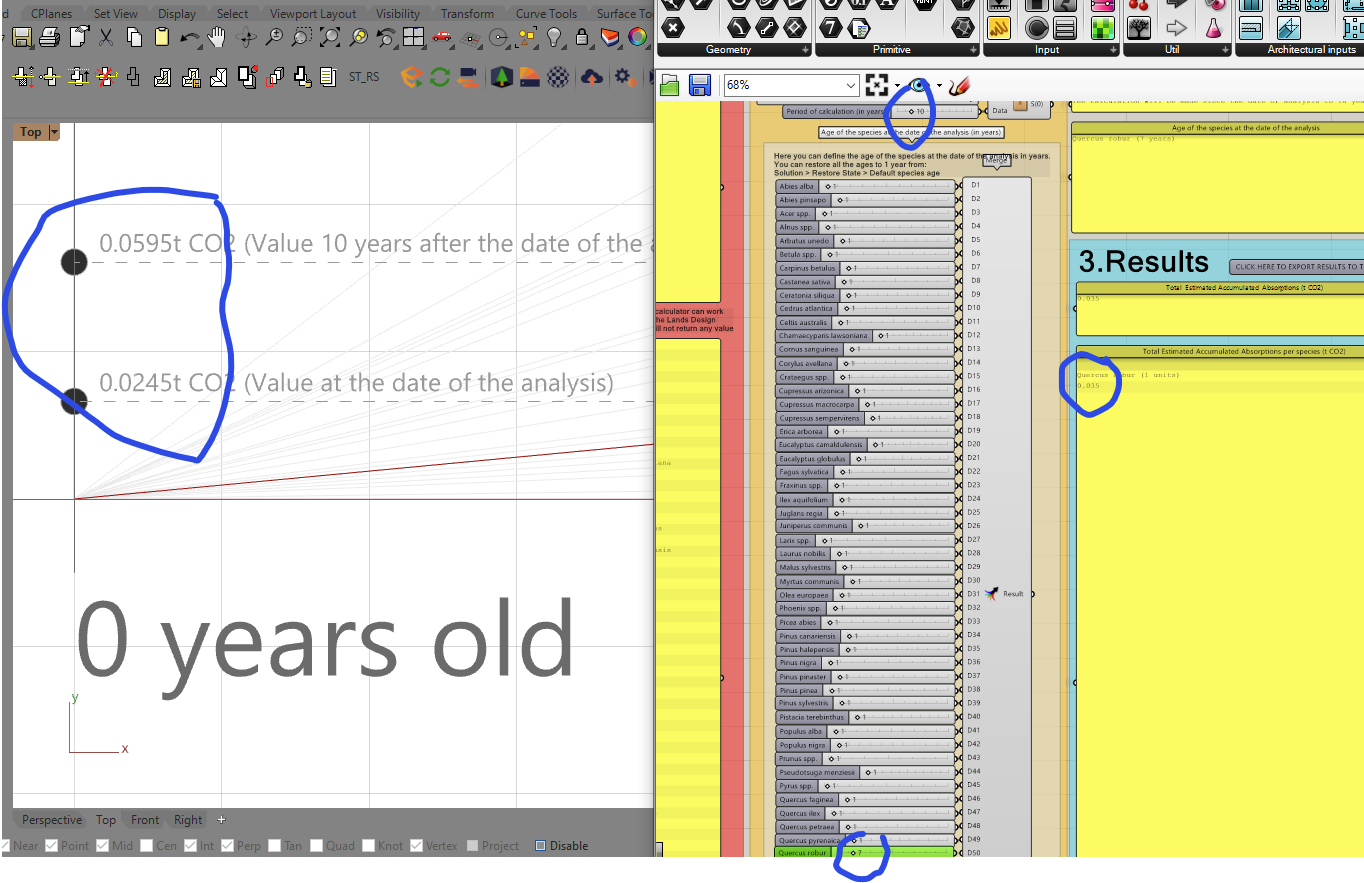
These values are fine. If you look at the graph drawn in the Rhino viewport (left part of your screenshots), you get two values for each species. On of these values is the “value at the date of the analysis” while the other one is the “value 10 years after the date of the analysis”.
However, in the panel in Grasshopper you only get one value. This value is the result of the subtraction of the two values in the graph. Actually, this is the value you are looking for, because it is the absorption in the period of time you have defined (in this case, since 1 year old to 10 years after).
I wrote these two values in the graph because we thought it could be useful to know how the final result was being calculated but maybe I should clarify this somewhere in the file…
[quote=“Alfonso Melero Beviá, post:5, topic:149708, username:alfmelbev”]
subtraction of the two values in the graph
[/quote] That explains it a biiit better But why is it that all the results no matter if its 1, 5 or 7 years old ends at the same number “0.35”? Shouldn’t the CO2 absorption grow as the tree grows or is this relatively the same during a trees grows untill a certain age? That was why I was questioning the result, but now that I see the calculation I guess its just how the CO2 is being estimated for the trees according to this data or?
This is really nice to know, but yeah, it would be nice with an example explaining how the calculation is being done, and how its changing from year 1 to year 5 to year 10 etc.
Year 1 to 9 = 0.035 Total accumulated Absorption per species
Year 10 - 20 = 0.040 Total accumulated Absorption per species
Does that make sense?
It’s such an impressive work you have been doing, and i’m super grateful that you share it!
I’m really hoping I can use it in the design process of a varies of projects and I will keep you updated how its working for me