Hi,
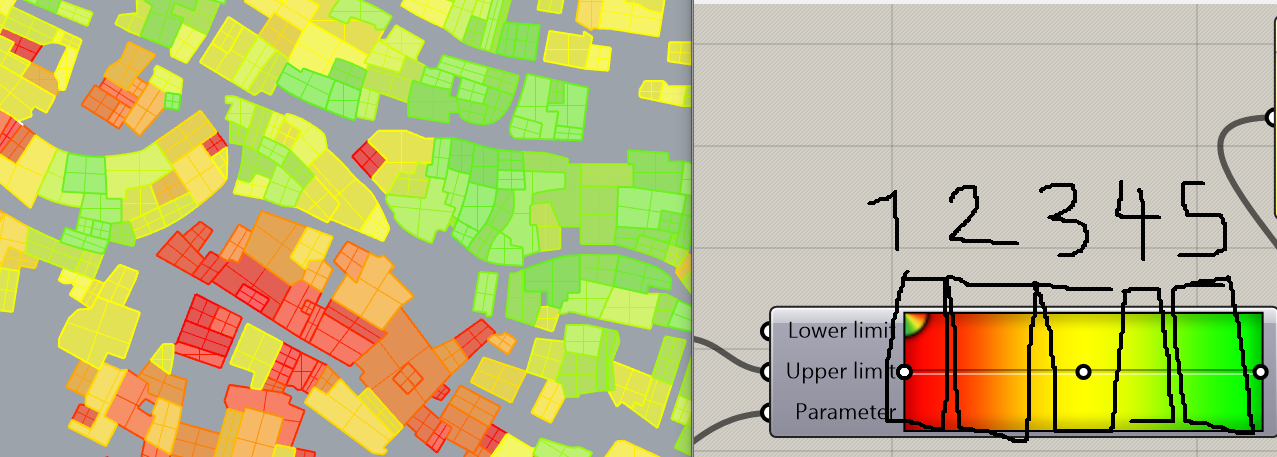
I have made some analyses of rhinos. Colors from red represent this analysis to green in grasshopper. Since my data was large, I had to bake a bunch of geometries every time. All my geometries are baked and represented by colors (Gradient) spectrum) in rhino. I was wondering if there is any way in Grasshopper or any other computational plugin to give me a percentage or number of these geometries that give me an idea of how many of these geometries are red(1), Red-Yellow(2), yellow(3), yellow-green(4), green(5), I have illustrated these colors in the image that I have attached. (in Gradient section)
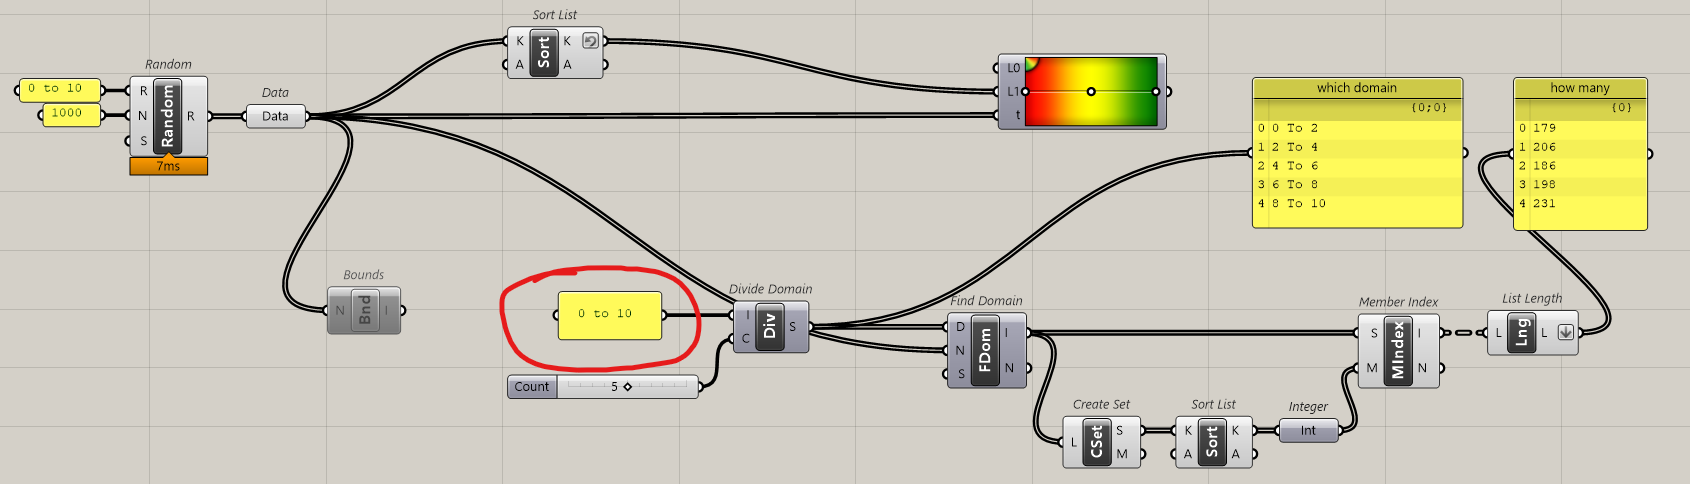
something like this should work, there might be easier ways

Data.gh (11.7 KB)
actually Bounds is not the best fit for this… I would just reference a domain manually depending on your Data, expecially if you are going to compare different data sets using the same definition?
1 Like
Thank you so much for the reply!
Since my surface is all baked, All the colorful surfaces are represented in rhinos. Is there any way to transfer the color value of surfaces in Rhino to a grasshopper and then process the sorting into 5 categories?

I personally would prefer do this before baking, when the values you want to analyze are numbers and not a color, but for sure you can reference your geometries back again in GH and get their Rhino Attributes (among which you’ll see the Color) using something some plugins like Elefront
I honestly have no idea on how to go to transform the color data into a single value that represents how much “something” is present, maybe based on Hue?
1 Like
Thank you so much! I really appreciate it.
Hope dies last (should die first).
LINQ_GroupRndColors_V1.gh (113.4 KB)
awesome stuff, as always ![]()
I think it’s important to point out that, by grouping the “t” values in N groups before baking, you will get an “absolute” grouping of values based on the initial Domain like here:
while by importing the surfaces and extracting the colors, you will get N groups based on the Bounds defined by min_Hue and max_Hue that are found among the surfaces, sort of a “relative” grouping instead of an “absolute” one
Anyway … get some stuff more (or less).
LINQ_GroupRndColors_V1A.gh (120.6 KB)
1 Like
doing my best to learn from your code, I’m going line by line like a monkey ![]()
think you meant gMin and gMax at line 132 and 133

What an idiot. Sorry. Blame that crap AMG W13 F1: How can Lewis grab his 8th crown with that thing? And why Toto fired James Allison a year ago? Maybe he’s playing the double game? And why Mercedes accepted these “ground effect” [and pigs do fly] new rules done by a true idiot?.
Note: current rules have nothing to do with THE car (Lotus 78 of 1977 by Colin Chapman), But Colin was a genius while Tombazis … well …
For the brave: define a Class (say CInfo with suitable properties: Color, R/G/B, Hue, Index etc etc), Sample the random (or not) Colors in a List and do the LINQ on that List avoiding the ultra stupid/slow IndexOf part - for sampling the grouped item indices into the Tree.