Hello everyone, I am desperately trying to create a GH script to connect specific curves (see image). Unfortunately, I have not been successful. I have attached a Rhino file. I am very grateful for any help.
Best regards,
Willy
Hello @inno ,
There are lots of individual curves. I’d like to connect some of them, while others should stay as they are. (see image)
Somehow, I’m stuck and need a push…
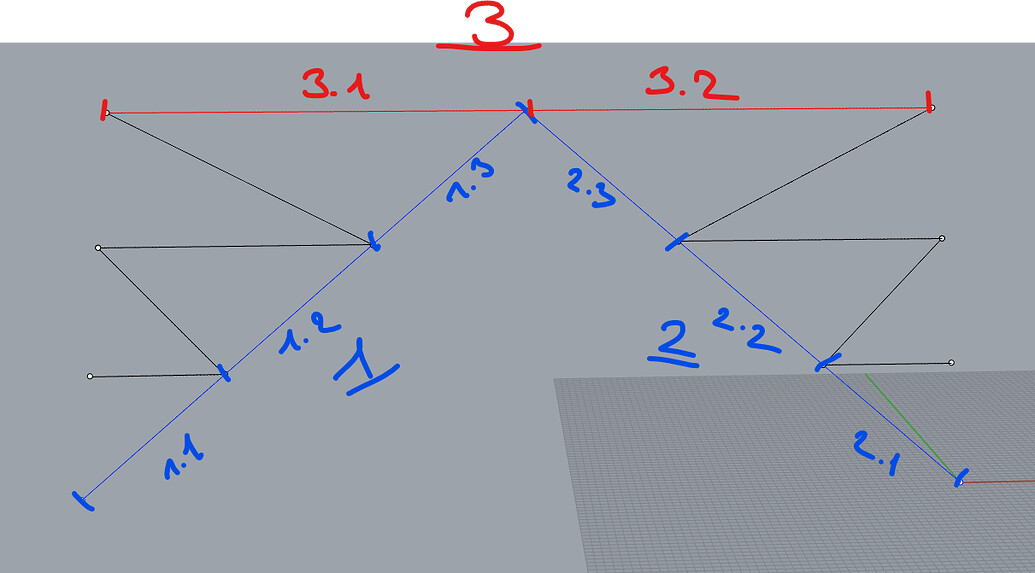
is this something like “given a List with all the Lines in the 3dm file, isolate 1.1, 1.2, 1.3 and 2.1, 2.1, 2.3 and 3.1, 3.2 and join them together”
if that is right, I think one approach might be to populate List of Lines wich are parallel to each other, and at the same time they have one end-point in common: once all the Lines are parsed, join them together
curves 1.1, 1.2, 1.3 and curves 2.1, 2.2, 2.3 are NOT parallel (!!!) so the shady Point Groups for angle-grouping and a slider to define angle-grouping-tolerance
If you have Elefront plugin you can sort curves by their color and then join only those together.
Edit: Oops I missed that you needed the blue curve to be split into two.
Hello @inno , thank you so much for your suggestion and your time. I will try your suggestion on the big curve bunch.
My idea was to try it with vectors (vectors in the same direction). However, I’m not good with vectors and couldn’t make any progress. Thank you again!
Hello @ftzuk ,thank you, but unfortunately Elefront won’t be able to help here, as the data (DWG partially all in one layer) comes without any information.
The example I “colored” myself and distributed into layers.
Thank you
if you have many similar instances of that curve arrangment in the same drawing, that might require some aditional steps (probably something to separate instances), and I guess also replacing the Flattens with trim tree here and there
dirty sketch where A groups Line instances together based on midpoint proximity:
Hello @inno ,
thank you again for the support. It really helps a lot.
However, I need to rethink my concept in general, as I need “cuts” (Z direction) more often than I had initially thought. Alternatively, I need to work with vectors…
A BIG thanks again!
are the Lines in your 3dm file the only Lines/Curves that will be present in the final file you are going to work on?
like, by using Geometry Pipeline to import all the Curves present in the final drawing, we will get exactly 52 elements, and they will always be on XZ plane?
due to the particular conformation of this network of Lines, it happens it would be possible to identify each individual feature you request based on Node Degrees, but you need to be much sure of what Curve/Line entities your final drawing will contain… so the main question is still the same when you open the drawing you have to extrapolate those data from, is that drawing exactly like the last 3dm file you attached, the one with 52 curve entities in total, or it may vary?
Hi @inno ,
you are very kind … and I am lazy .
Lazy because I HAVE to keep clients happy until Christmas.
You represented it correctly in your example. BIG Thanks!
Answers to your questions:
Yes, it is just an example, and there can be significantly more curves than 52.
In this example, after joining the curves, 37 curves should be the result.
1.1 - 5.3 (not pink) should join at the end, the rest remains.
There always have to be interruptions (e.g., Level 1-5). Other files Level1-xy…
I couldn’t find the node (vertices)… Plugin?
Thank you again very much for your ideas, and I wish you a Merry Christmas!
Didn’t use any plugin for the image with Nodes and Degree on the previous post, it was just a Point Groups with low tolerance, applied to all Start/End Points of any curve in the drawing
the thing is, starting from a 3dm drawing that contains already polished data might not the best way to attack the problem… because when you try that on real-data then it won’t probably work anymore