Hi all
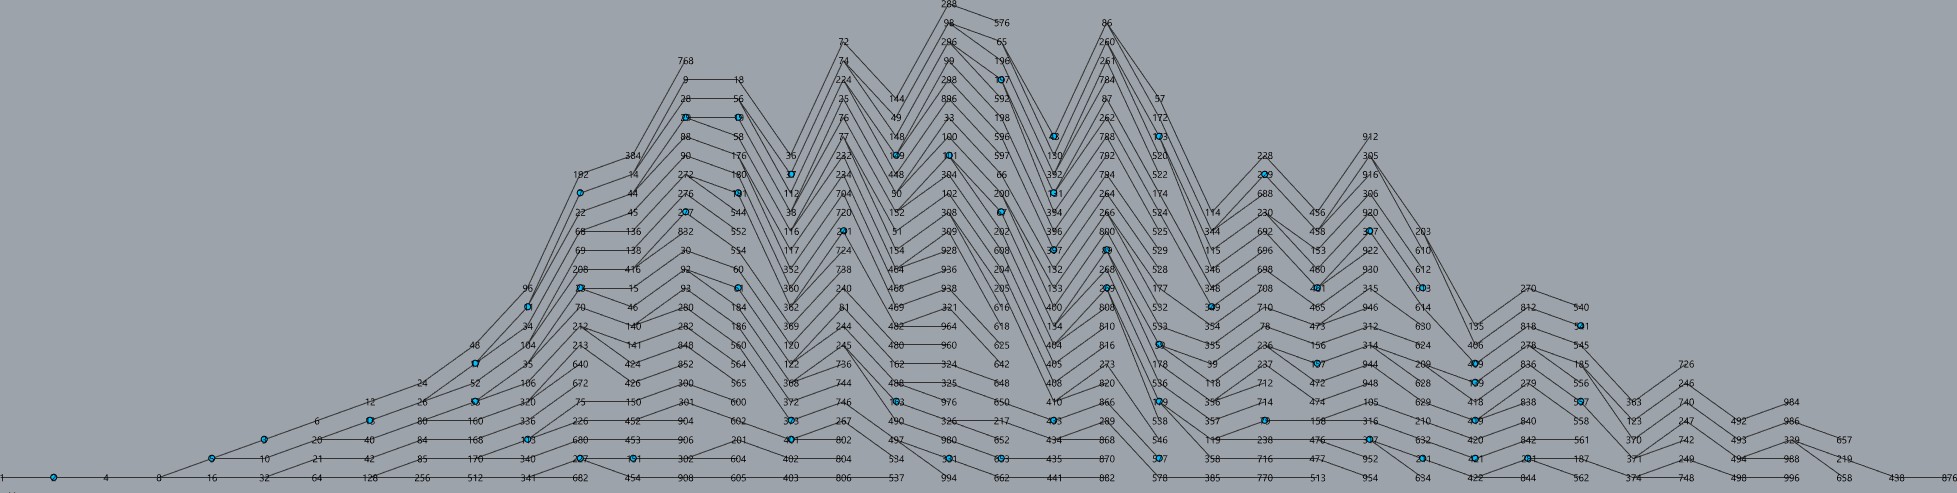
I am trying to learn Python and decided to try making a script to visualise the Collatz Conjecture as a study exercise. I somewhat succeeded in generating the branching lines I was going for, but as I am still learning, this left me with lots of questions.

-
In order to get the multiple threads, and multiple Collatz sequences, I simply input a range rather than a unique integer to my x input. I am pretty happy with the way the output is organised, but I was wondering if there would be any advantage in making this input a single value (total number of threads) and integrating a for loop in the code to get the sequence for each individual thread? And how would you go about writing it?
-
The way I am visualising it here, all the lines overlap as they converge down to the base point. I was wondering if there would be a way to avoid this? Maybe by adding a new function that would clean the sequences of duplicate numbers after a minimum duplicate is met? But that would leave me lost on how to create the starting lines for each new branch.
-
I would like to control the length of the new lines by applying a multiplier to them depending on the iteration (ie. to make them progressively get shorter or longer with each iteration). Should I simply use rs.VectorScale and use i * scalefactor?
Edit: This turned out to be much easier than I expected, I simply added rs.VectorScale at the beginning of my for loop after the creating the vector. -
And finally I would love to try and make this grow in 3 dimensions, but I am not sure what sort of rule could be set up for Z axis transformation, while maintaining the common values of each sequence aligned. Ideally I’d want to rotate the vector along x or y axis at each branching intersection, but I’m not sure how to go about doing that. Or maybe create the rotation depending on the value of the number in the sequence? That way common values would always rotate the same way? Would there be some way of avoiding branches from colliding?
And of course, if you have any suggestions on cleaning up the script making it more efficient in any way, I would also really appreciate it. I am still very much a beginner so writing everything out and making the code as explicit as possible helps me a lot, but all suggestions are welcome.
Thanks!
201229 - Collatz Conjecture.gh (13.0 KB)
import rhinoscriptsyntax as rs

#create collatz sequence
def collatzSeq(i):
    seqList.append(i)
    while i > 1:
        if i % 2 == 0:
            i = i // 2
        else:
            i = ((3*i) + 1) // 2
        seqList.append(i)

    seqList.reverse()

#create list to store sequence numbers
seqList = []

collatzSeq(x)

def collatzViz(sequence, startLine, evenRot, oddRot):
    newLines.append(startLine)
    for i in sequence:
        #find the start and end points of the input line
        endpt = rs.CurveEndPoint(newLines[-1])
        stpt = rs.CurveStartPoint(newLines[-1])
        #create a vector from end points
        vect = rs.VectorCreate(endpt, stpt)
        if i % 2 == 0:
            #define an even value for rotation
            #evenRot = -20
            vect = rs.VectorRotate(vect, evenRot, (0,0,1))
        else:
            #define an odd value for rotation
            #oddRot = 20
            vect = rs.VectorRotate(vect, oddRot, (0,0,1))

        ptadd = rs.PointAdd(endpt, vect)
        #create line and add to main list
        newLines.append(rs.AddLine(endpt,ptadd))
        #call recursive function

#create list to store resulting lines
newLines = []

collatzViz(seqList, startLine, evenRot, oddRot)

#output
a = seqList
b = newLines