Hi all,
This is my first time posting - apologies in advance if the answer is obvious, I am very new to Grasshopper.
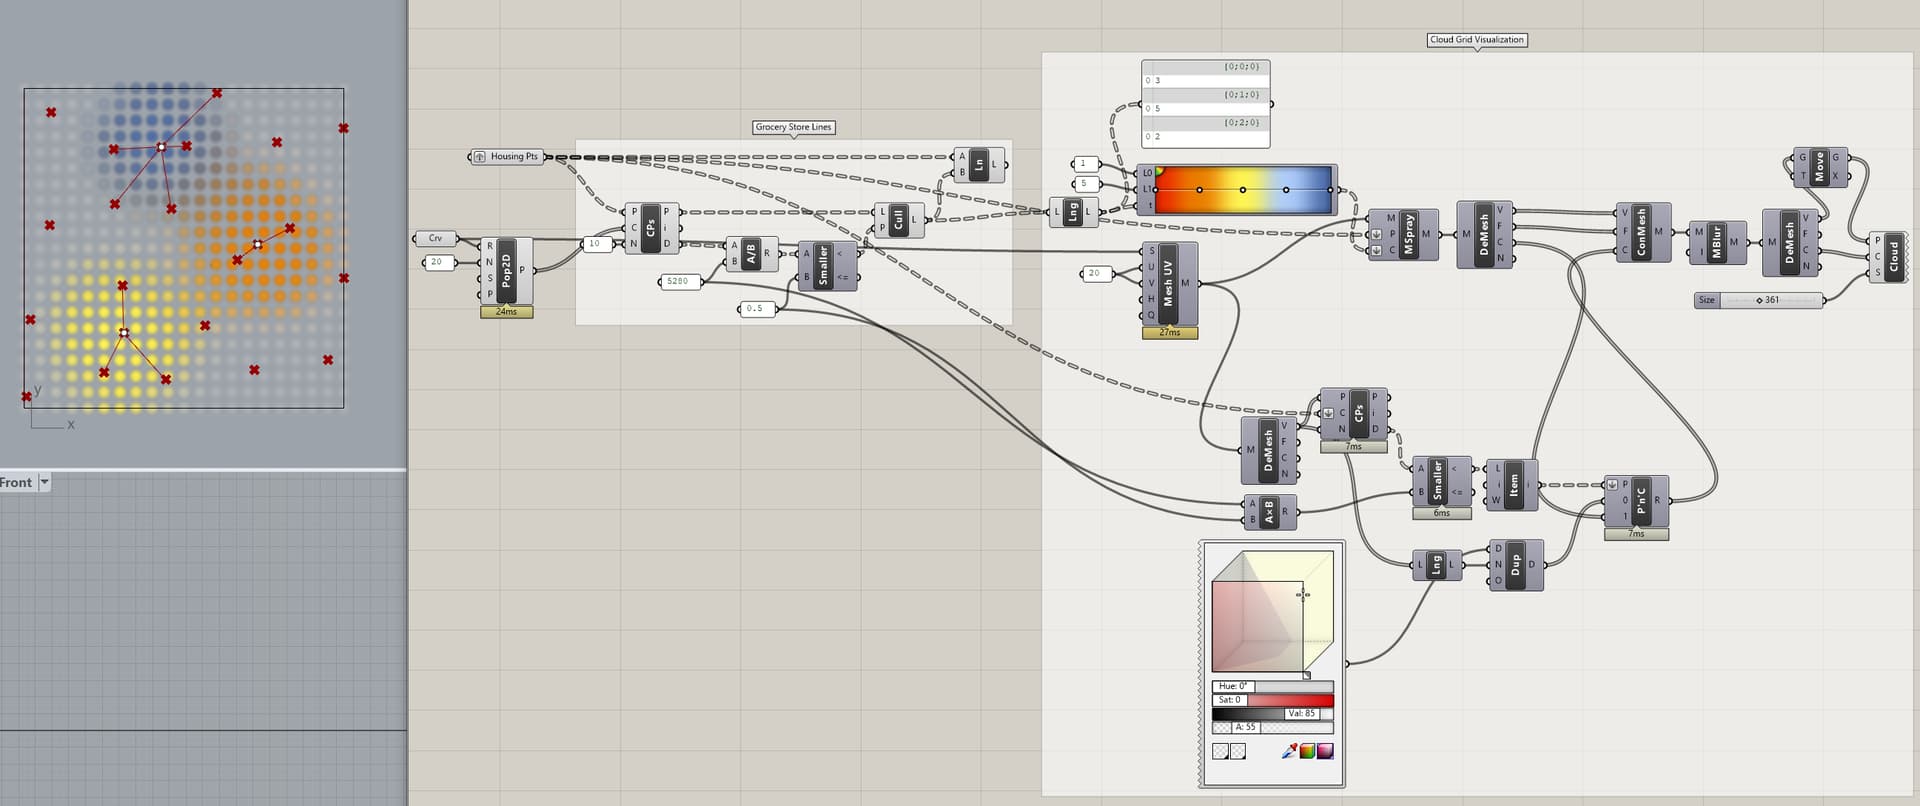
I am creating two scripts with imported GIS data to visualize relationships between housing, food accessibility, and parks in DC. My first map (image below) is attempting to connect each affordable housing location to grocery stores within a quarter-mile radius using lines. I thought I could use the Closest Points and Line components, but obviously I am missing something.
My second map is a fuzzy cloud grid that gradates colors depending on how many parks (between one and five) are within a half mile of an Affordable Housing complex (I hope to also change the size of the clouds depending on income data for each grid - holding off on this for now). Again, I’m realizing my CPs and Proximity components are not accurately capturing the relationship between the two variables and instead are just showing the density of parks.
Both scripts appear to be missing relativity - any tips on how I can best relate the Affordable Housing data back to the respective Grocery Store and Park data identified in the CPs components?
Thank you!