Hi everyone, I am trying to create a script which allows me to extract a series of points within irregular curves by inputting the amount of points (density). These need to be laid on a regular grid with fixed distances. Can anyone point me in the right direction please?
Thanks a lot Joseph - this works well. I’m not familiar with Kangaroo, so I’ll give it a look.
As the file title suggests, I am looking to apply this script to several planting beds, so that I can identify planting numbers quickly, then dispatch points and draw circles (plants) with different radii for different species.
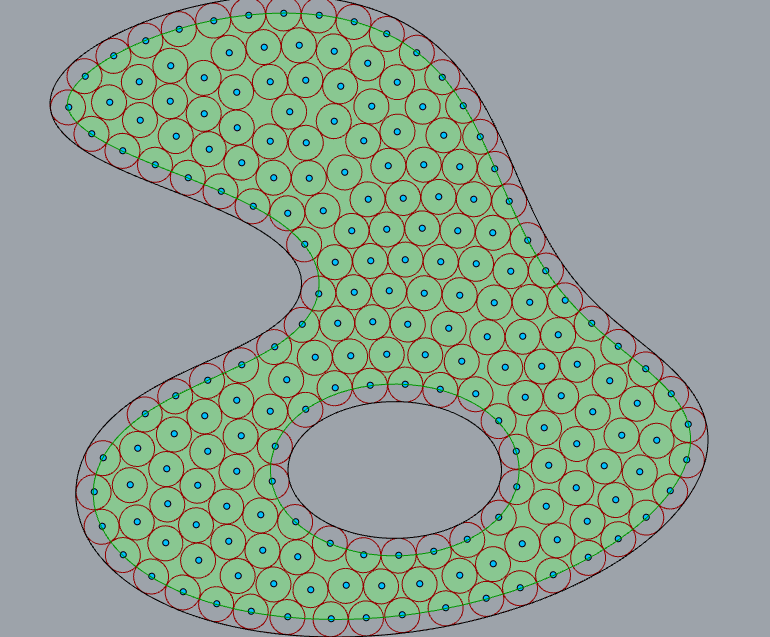
Yeah, but without examples, we don’t know if they are all rectangular (where a different algorithm might work) or truly irregular as in the image I posted. In either case, circle-packing may be the best.
Thanks for your help - it will be a mix of rectangular and irregular shapes like the one you posted. So I imagine I could use either script depending on the shape.
Circle-packing may not give you a square point grid, as your title suggests, but the points will be evenly spaced from each other. For rectangular plots that are not square, you don’t have a suitable algorithm yet, though I imagine it depends on the ratio of short side to long side somehow? For trapezoids like the one you posted, that pattern of points is not “a regular grid with fixed distances”. For truly irregular curves, all bets are off! I’m not saying it can’t be done but an entirely different approach is required.
Here is an approach that gives you a “proper” point grid, aligned with the longest edge (or a line that you supply - cyan group),. You define the space between columns and rows using a Rectangle component wired to the ‘C’ input of ArrRec. I used one slider for both dimensions (X & Y) so the grid is square, but it doesn’t have to be.
The ‘X’ and ‘Y’ count inputs to ArrRec are computed from the U and V dimensions of a Bounding Box, then InCurve and Cull Pattern are used to select only the grid points within the offset curve. Adjusting the rectangle dimensions affects the total - it’s not automatic.
Your dimensions are HUGE Millimeters? One effect of such large dimension values is that it’s very difficult to see plane icons and their axes so it’s hard to tell how they are aligned.
P.S. The results depend too on where you start the grid, which is somewhat arbitrary. For example, do you really want a row or column with only one plant?
The cyan group lets you choose among a set of test curves. I have four now, all roughly the same area and located at the origin. Index 0 is your trapezoid, 1 and 2 are the curve I posted and 3 is a square, The code looks for edges that are lines and chooses the longest one to initially align the plane. When no lines are found, alignment defaults to ‘World XY’.
In either case, the ‘Angle’ slider (blue group) allows rotation of the point grid ±180 degrees.
P.S. Oops, I just noticed an error. When separate sliders are used for Rectangle ‘X’ and ‘Y’ inputs, as I did in this case, the ‘Y’ slider must be connected to the ‘B’ input of the A/B component who’s ‘A’ input comes from the Dim ‘V’ output. A quick fix is to connect the ‘X’ slider to both ‘X’ and ‘Y’ inputs of Rectangle as before, making a square grid.
I think I’ll leave the flaw because it’s important to understand this part of the code, in case you want different separation for rows and columns in the point grid.
UPDATED: Added X_dim and Y_dim params to make the wiring less error prone.