Another newbie dipping his toe into custom component development…
In the past weeks, I have been creating a custom component (about 600 lines including comments), using the C# IDE component . However, as computational features are added, I have moved to Visual Studio primarily for its debugging feature and class management. Within VS the component code compiles, the debugging symbols load, but I am not able to get past the breakpoint message as shown in the title.
Present features of the code are:
As I am learning C#, I have defined all methods (functions) procedurally, and not used classes. All the methods are defined within the SolveInstance method. As soon as the debugging is working, developing with classes and instances is next on my list.
The sample code provided with the Grasshopper template debugs just fine with the same project and debug settings.
I am using the latest version of Rhino, and targeting .net 4.8 for compiling.
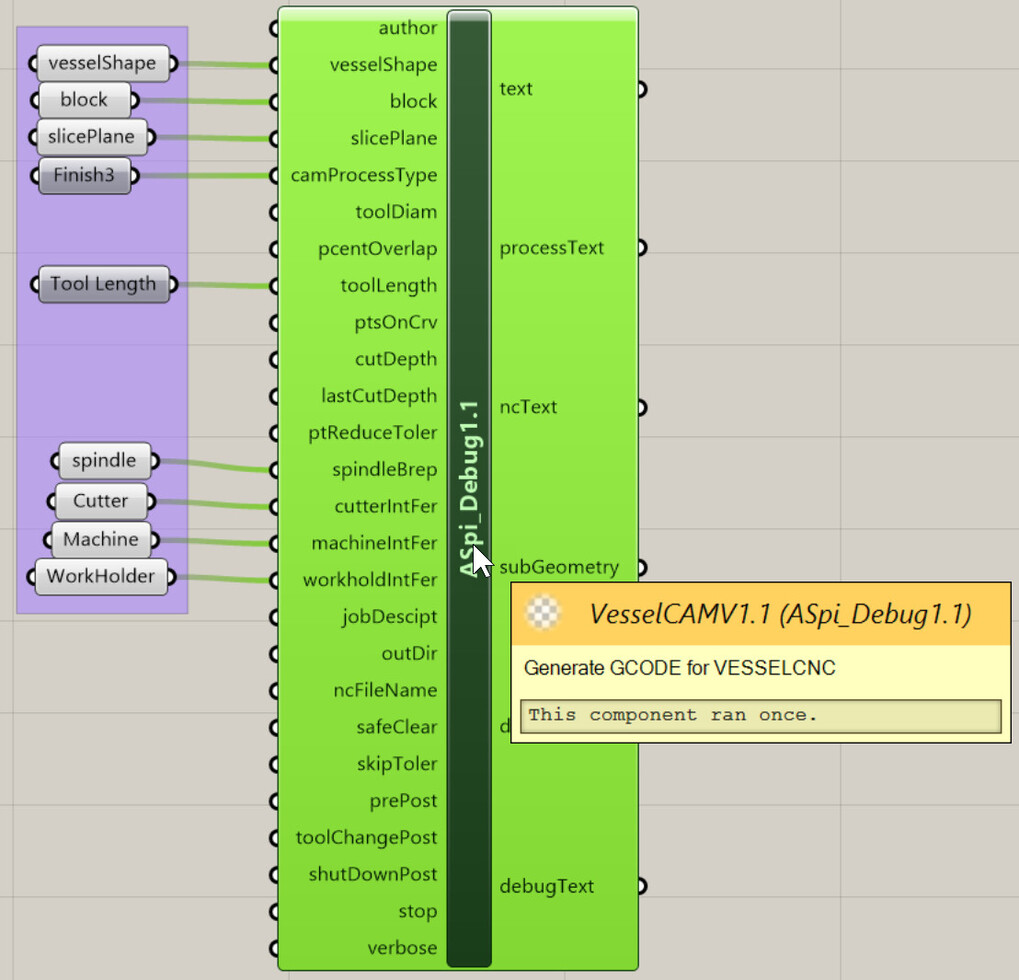
The component itself can be placed within a Grasshopper file, and once the ports are hooked up, it says that the component ran once without error.
The purpose of the component(s) is to generate GCode for a specialized CNC machine I am building.
I get the same debug error message. (I am using VS2019.)
Prior to this reply, I did a clean reinstall of Rhino. Interestingly, the D:\ drive is a secondary partition on my desktop that I use for backup. I would have assumed that with a clean reinstall, Rhino would have created this \Grasshopper\Libraries file on the C:\ drive, ie, the boot drive. I also find that the Grasshopper template defaults to the C:\ drive for the start program.
C:\Program Files\Rhino 7\System\Rhino.exe
Program
I am going to change pointing to the on the D:\ drive and report back. This has got me stumped.
Though I assumed there might be a conflict with Rhino starting from the C:\ drive when debugging and the compiled custom component residing in the D:… Grasshopper\Libraries, my testing did not remove the error.
Therefore, in a attempt to keep everything ‘vanilla’, I have adjusted the following:
GrasshopperDeveloperSettings → C:\Users\ds463\AppData\Roaming\Grasshopper\Libraries\
The compiled component loads fine, the debugger can see the .pdb file, and once the wires are attached, the component run once.
Looking at the error message more closely three options for the fault are suggested, with the last being most suspect. (There are no conditional compilation or compiler optimizations. I don’t know how to adjust compiler settings.)
Good afternoon… Still offering hints of my debugging error anomaly. Assuming some settings were the cause of the debug fault, I created a new solution and replaced the example code with my code in the VS solution. It compiled fine, and can be placed in a Grasshopper file. However, breakpoints work for the DA.GetData portions of the SolveInstance method, but do not stop at any code blocks of my custom code. Please see below:
By contrast, in a separate template provided example code, if I set a breakpoint at the only function call (CreateSpiral), I can step through the function definition with its loops, without issue.
Thanks Nicholas, that was it!
My mistake was that by dragging the component.gha file onto the Grasshopper window, automatically Rhino placed it into the Grasshopper\Libraries folder and I could drag that component from the menu onto window. My dismay was that I could see that the custom component was attached and the symbols loaded in the debugger Modules window. This was a false positive.
However, without also moving the component.pdb file into the Grasshopper\Libraries folder, the VS debugger cannot truly see the debug symbols. Your recommendation was spot on!
Dave