After waiting years for the parameter order problem to be fixed I actually started down the route of writing my own rhino plugin based on my kite design code. Have spent 6 months or so working on getting that to a level of usefulness.
This morning I decided to have look at my Shapediver/Online design tool and give it a much needed update.
My local def loads on my 6yo i7 laptop in ~10 sec and recomputes in about 3.5sec:
I’m really in the WTF am I meant to do here - my code is 10x faster than the SD ‘limits’ yet fails on upload. It also fails without ANY idea where to look in the just over 3000 components in this GH file.
I really need more of a reply than the link to the SD optimization blog post guys - what can you actually help me with.
Even with the tolerance set to something that works better for my Def I was seeing a server time out on one very specific set of parameters that a client needed.
Managed to track that one down to a boolean split that was a little too close to an edge - extending some lines helped solve that.
Next up I was projecting some curves onto a Brep that was running OK locally but I suspected was blowing out the SD environment. That was pure decoration in the display - deleted and not going back.
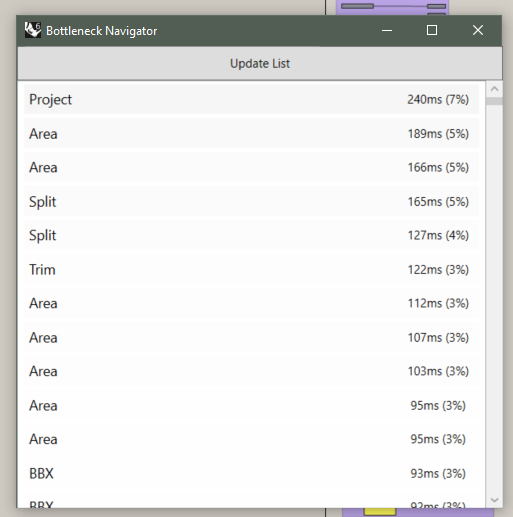
After those I started looking at every single item on the bottleneck navigator:
In particular I was using AREA components to find points for sort operations. This is a BAD idea - the Area component has a long run time. I replaced a bunch of these with Deconstruct Brep etc and found a huge speed increase.
Glad to hear that you went down the rabbit hole of optimization and managed to get much better performance from your definition. Regardless of the performance of the ShapeDiver system and discrepancies you might experience, this is always going to help. That being said, you have pointed out some valid concerns regarding the system:
Tolerance settings: I agree that we do not mention this detail nearly enough and that documentation should be improved about this point. It can really make a difference.
Remaining discrepancy between local vs server computation time: an important point here that was maybe not discussed a lot in the past is the size of the definition itself (in terms of the number of components). While locally the number of components can increase a bit the loading time but have almost no effect on further computations, it is different on our servers because all components need to be parsed at a point, for multiple reasons (allowed and disallowed components, preview on/off, scripts, etc…). This parsing is then more or less proportional to the size of the definition, regardless of how fast it is locally. We are now investigating further this impact and cases where it can be improved. While it is difficult to measure, I can confidently recommend strategies to reduce the number of components when possible, by means of clusters or, ideally, smart manipulation of data trees which can successfully prevent the multiplication of instances of the same component.
I hope those comments clear up some details. Our parsing and dispatching algorithms have come a long way already but we are well aware that there is still a lot of room for improvement. As a matter of fact, we consider this to be one of the most valuable parts of the ShapeDiver infrastructure: rhino.compute has made it much easier for developers to launch a cloud system running Rhino and Grasshopper, but the performance and scalability of such a system remains a considerable challenge about which we have been developing solutions for many years now.
That makes a lot of sense and does clarify what I was seeing.
Would it perhaps be possible to create a component that estimates the SD run time for a Def? That would be a useful development and debug tool esp for more ambitious pieces of code like mine.
Later this year we will roll out our IDE for Grasshopper which will make it even easier to upload models (directly from Grasshopper), and will also provide useful feedback about computation time etc.