I was wondering if anyone who had digged into this complex subject of mathematical description of a curve could help me throught this journey.
What I’m after : Expressing graphically and mathematically (if not to complex), the construction of a Curve (to be more precise: at least a Bezier curve (which seems easier to explain then a spline curve or a NURBS curve)). And I’d like to make a simple GH script so I don’t have to manually draw all of this each time.
Before I use to deconstruct a line in segments and arcs like this :
(BTW if anyone as a GH script doing only this in Rhino, I would be really happy if the person want to share the base code )
Now I need a little bit more complexity, but still want to be able to describe it. Bezier curve didn’t seems too complex : couple of handle points with simple formula to trace the arc. (now seems that the complexity depend on the number of control points you add?). Something like this maybe :
As I understand it (for now), giving the coordinates (distance, angle, position,etc) of these ancers points to a ‘‘constructor’’, he would be easily able to rebuild it ?
You can come up with a notation for various types of curves that Rhino supports and then parse that text and output curves. For example, you could define the following notation rules:
Two or three comma separated numbers in parenthesis always indicate a World XY(Z) coordinate.
Two or three comma separated numbers in square brackets always indicate a World XY(Z) vector.
Comma separated points and vectors in curly brackets indicate various kinds of curve. For example {point, point} would be a line, whereas {point, vector, point} would be an arc with a tangent constraint, and {point, point, point} would be a three-point arc and {point, point, point, point} would be a degree=3 bezier segment.
Now you can write down curves like this:
{(0,0), (10,10), (10,-10)}    // a three-point arc.
{(0,0), (0,-10)}              // a line.
{(0,-10), [0,-1], (10,-10)}   // a tangent arc.
Mathematically however you have to decide what sort of form you’re after. It could be an explicit one in the form of a regular function graph: (x, f(x)). Or maybe multiple functions of a single parameter for curve position in x and y separately: (f_x(t), f_y(t)). Or maybe an implicit form where you’re defining points on the curve using some equality: f(x,y) = c.
Thankyou for your answer! I should have been more specific.
I’m looking more for a visual / graphical description of a curve. Its geometry lets say. Its in the same direction as what the curve analysis component does in GH. (But the component only give us the curvature, which isn’t enough
it Could be something like this, but as I don’t fully understand the mathematical functionning of a bezier or Nurbs curv, I don’t know exactly what to represent.
You can convert any curve in Rhino into a NURBS curve, and a NURBS curve has a canonical form. That way you don’t have to worry about other curve types like lines, polylines, arcs, circles, ellipses, bezier spans, …
It’s a list of weighted control-points and a list of knots. The difference in lengths of those two lists tells you the degree of the curve. The interval from the first to the last knot tells you the domain of the curve. The stacking of knots at the start/end of the knot vector tells you whether the curve is clamped or not. Knot stacking on the interior of the knot vector tells you whether there’s a kink on the curve interior.
The formulas for evaluating the position or tangent or curvature of a NURBS curve at a specific parameter are not easy, but well established. The control-points can be drawn as a polyline, although you’d need to figure out how to represent the weighting of those control points. In effect control-points are four-dimensional coordinates, although it’s usually better to think of them as three-dimensional homogeneous coordinates.
So: a NURBS curve is two lists: \left\{(x_0, y_0, z_0, w_0), (x_1, y_1, z_1, w_1), ... ,(x_n, y_n, z_n, w_n) \right\} + \left\{ k_0, k_1, k_2, ..., k_m \right\}
Ouf! A whole new world for me! As I understand there isn’t only control-points but weight associated to those control-points. I really have no clue how to extract the weight data in GH to furtur represent it (the representation part might not be here the difficulty). Not even sure if I can do that with GH native components. I will try something.
In a mean time, if you have any ideas how this could be done let me know David !
That said, maybe NURBS couldn’t be easily describe without a complex mathematical function (which isn’t what I’m after.). What about Bezier curves ? Seems a bit easier to graphically describe no ?
Thank you @DanielPiker ! Excellent! That’s what I’m after !! I will give this a try on a complex Curve! And your website is very very instructive + graphically clear. Thanks !!!
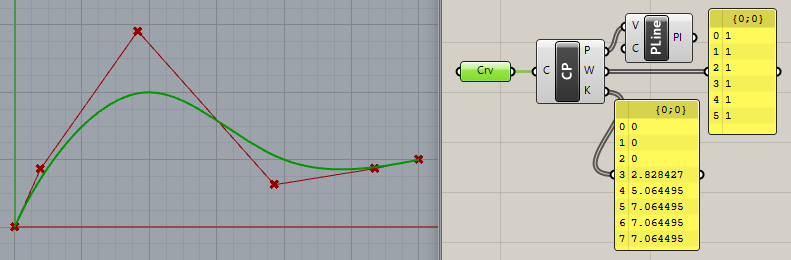
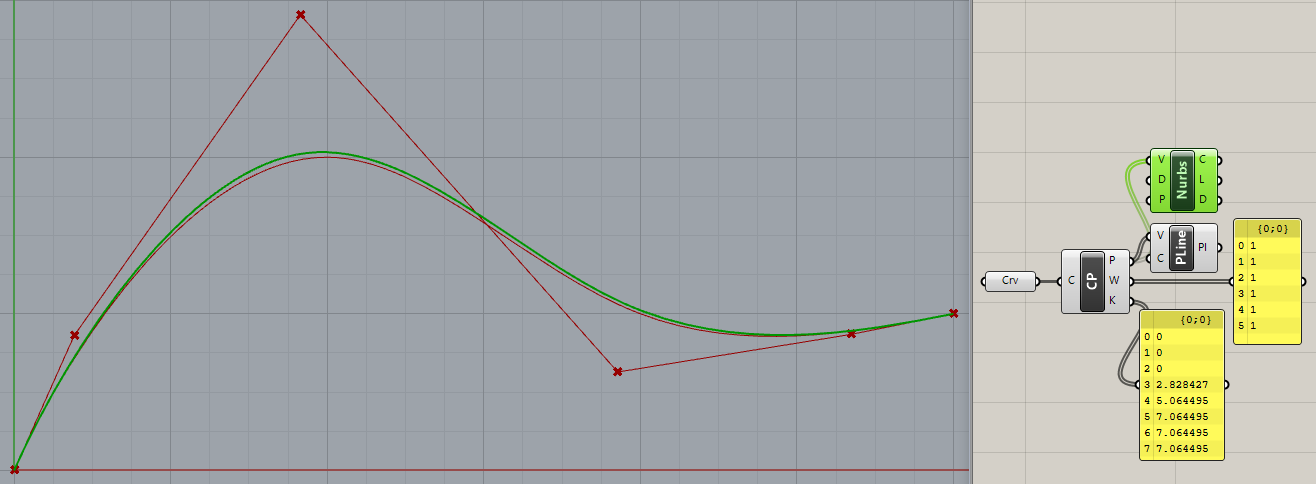
You drew your curve with ‘’_InterpCrv’’ command right ? I made a test myself and it seems that when you draw a curve with _InterpCrv command, decomposed it in GH and make a NURB with its Control Points, the result is slightly different. But when firstly draw in rhino with _Curve command, then NURB rebuilt in GH with its CP, the result is identical.
**Note: According to your observation, I also wonder why Knots doesn’t all are whole numbers. Isn’t it : Knots = Degree+N-1 (where N = number of Control Points).
Now it seems that no matter with what command its drawn in Rhino, Weight at each point is 1 : which means, according to this., that its a Non-rational curve. (Can we call it a NURBS curve?). So I’m asking: all drawn curves (no matter what command) in rhino are NURBS ?
So as I understand the Weight parameter doesn’t matter in a NURB ? oO . I’m a little confused here.
A likely cause of different shape curves is different knot vectors.
The parameter values of knot vectors do not need to be intergers, and the intervals between knot parameter values do not have to be uniform. InterpCrv as a Rhino command when interpolating through points provides a choice of how it calculates parameter values of the knot vector: uniform, chord distance between points or square root of chord distance between points. The different knot vectors will result in different curves.
Similarly curves with the same control point locatins but different knot vectors will have different shapes.
The weight parameter definately matters in NURBS. Change a weight and the shape of the curve will change.
A curve with all weights equal to 1 is a NURBS curve.
I don’t know know the details of Rhino’s internal code but all curves in Rhino can be represented as a NURBS curve.
Note that a valid knot vector may not have more consecutive identical knots than the degree of the curve, and values must always be either identical to or bigger than preceding values.
This is why I post-process the knots with a Mass Addition component. So the knots you pick are not the actual values, but rather the increments between them.
the C# component just repeats the first and last values in the list twice so you end up with three identical knots at either end of the list. Without this, the curve would not be “clamped”, i.e. it wouldn’t reach all the way to the first and last control points.

 )
)