Kia ora Wim. I understand this, and had shared this in the cross-post. If this is the appearance of the files in Shaded not Rendered view, I have definitely modified the Named Views to alter the clipping planes. The images do turn up.
I was referred to here to ask about the Colibri plugin not saving images. I linked to the blank files save question as at first there seemed a potential connection, even though my script was not saving images reliably.
The issue that remains is, as cross-posted in the LadybugTools related post:
" A couple of days ago, the script ran smoothly producing the required graphics files and .csv file.

This argues to me that the complexity of the script itself is not the issue.
I am certainly not expecting folks to dive into these complexities - it works.
What I am puzzled about is this:
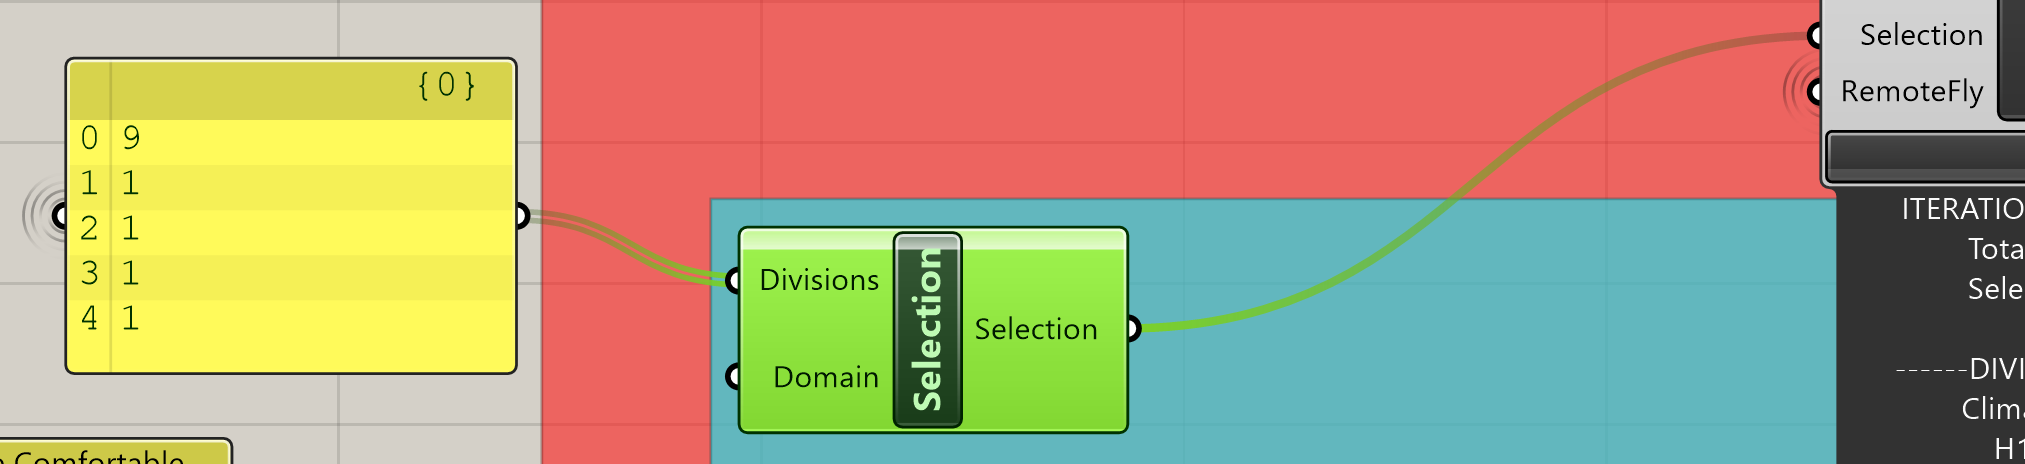
Currently, in the (red-brown section of the script) I have the following Colibri settings:

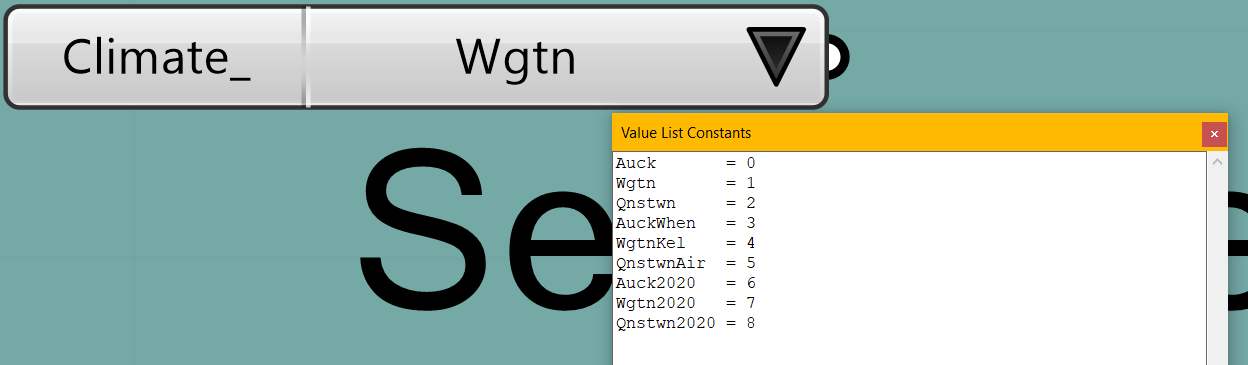
I am wanting only to run the Climate variations by Choosing a settings file that says:
the .csv fil gets written to disk but only with the column headings and while the run is happening, the running.txt file exists.
At each step, if the process is left to run through, the required images can be seen to appear in the NamedViews windows (in the accompanying Rhino file)
WHAT DID I DO?
From the successful run to this run I added more climates, 9 instead of 6.
The climate files are simply selected by an item selector

And the input to the item selector that is linked to the Colibri iterator is
Graphics_v14.3dm (208.5 KB)
2Zone-PerformanceSketch_NZBC-home_final_pollinate5_syncJune2022_test1Dim.gh (1.8 MB)
Essentially, I added items 6, 7 and 8.
BTW: If I run the Colibri sample file, it also works.
And finally:
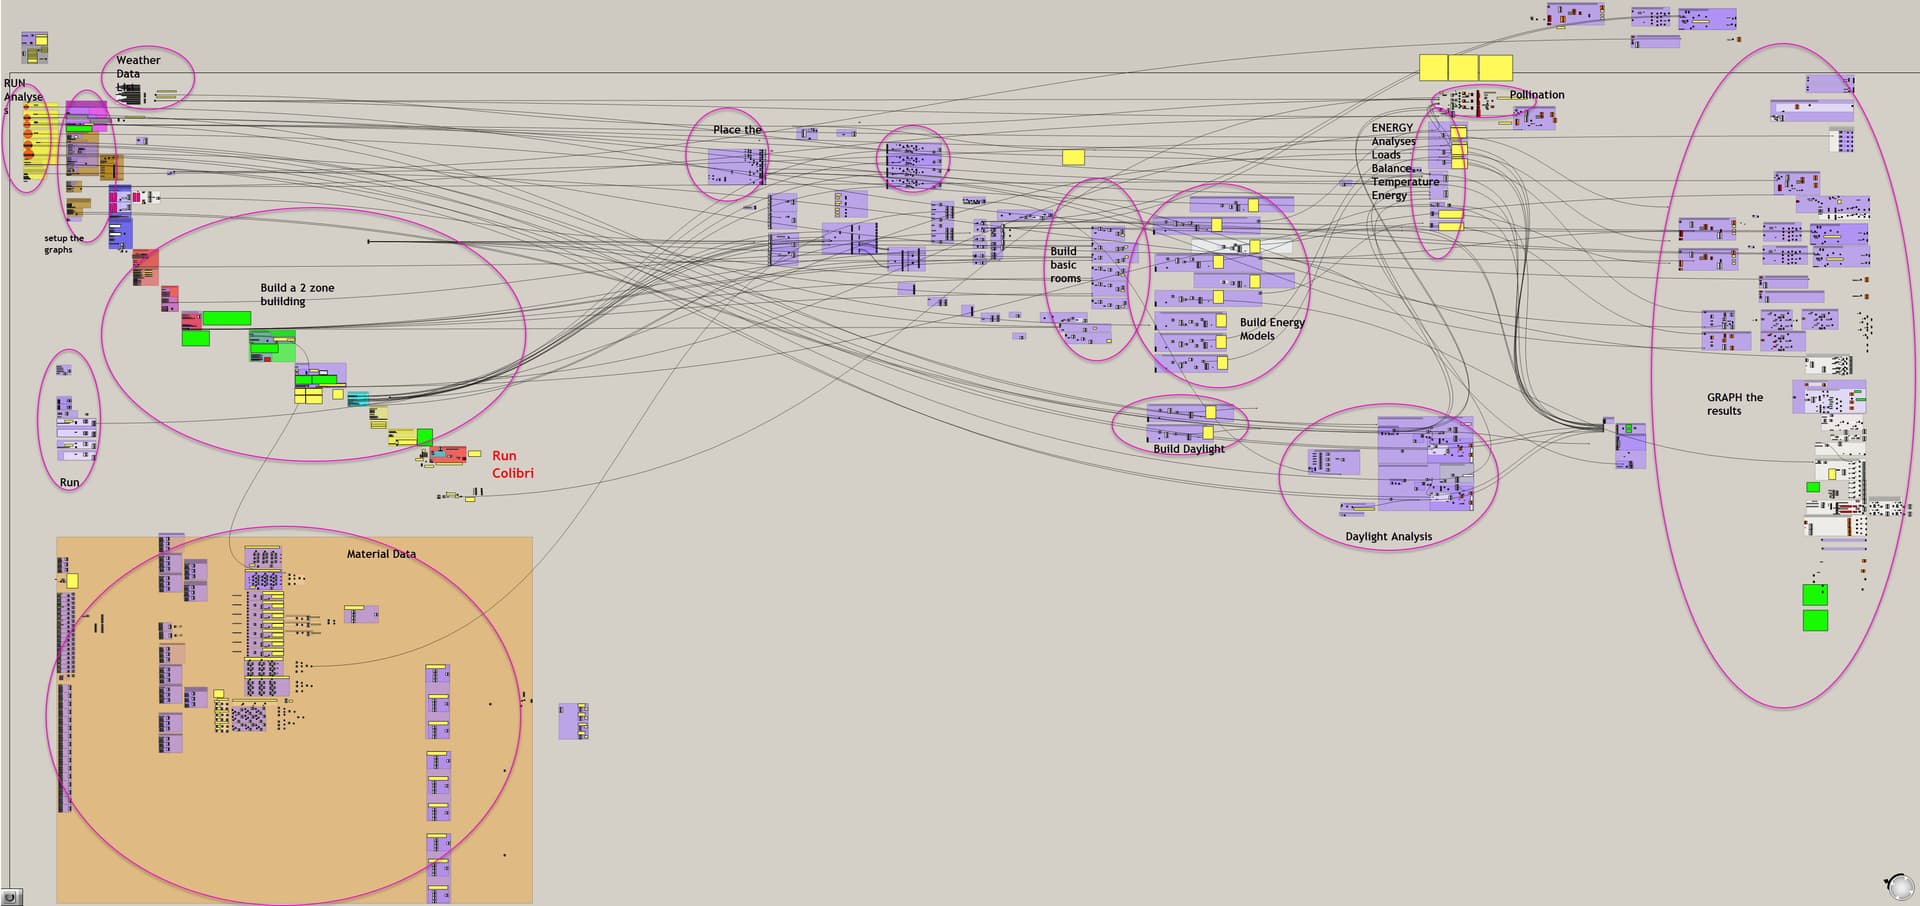
How to run the script without getting buried in complexity:
Open the Rhino file - it contains the named views.
In GH open the script.
It is set up to run 3 x LadybugTools (v1.5) simulations with Energy+ out of the box so you need to wait until the Named Views are populated with LBT graphics.
If the GH script opens in an unknown place then the eyeball icon can help you navigate the script:

Click the link 1. Run Menus takes you to the Toggles to run the various simulations.
Find the Colibri simulation control and run options using the eyeball link to Colibri Parametric A…
Simplifying the Colibri file path and filename does appear to produce more images on disk but not a reliable number. The process seems to stop saving images at random.
Most recently, of the 45 images hoped for (9 climate selections x 5 pictures) 37 were actually produced, even though the data.csv file showed that the results had all been produced?
I have explored the 37 of 45 images online, and noted a clue (finally!) that it would clearly seem to be the save image timing of Colibri. To produce the outputs that I want requires me to run Energy+ three times for each Colibri option.
At first glance uploading 37 images plus the data.csv file to Design Explorer https://goo.gl/BL_3N8wovK produces something that looks good, apart from some unsaved images.

However, looking at the details there is a clue:
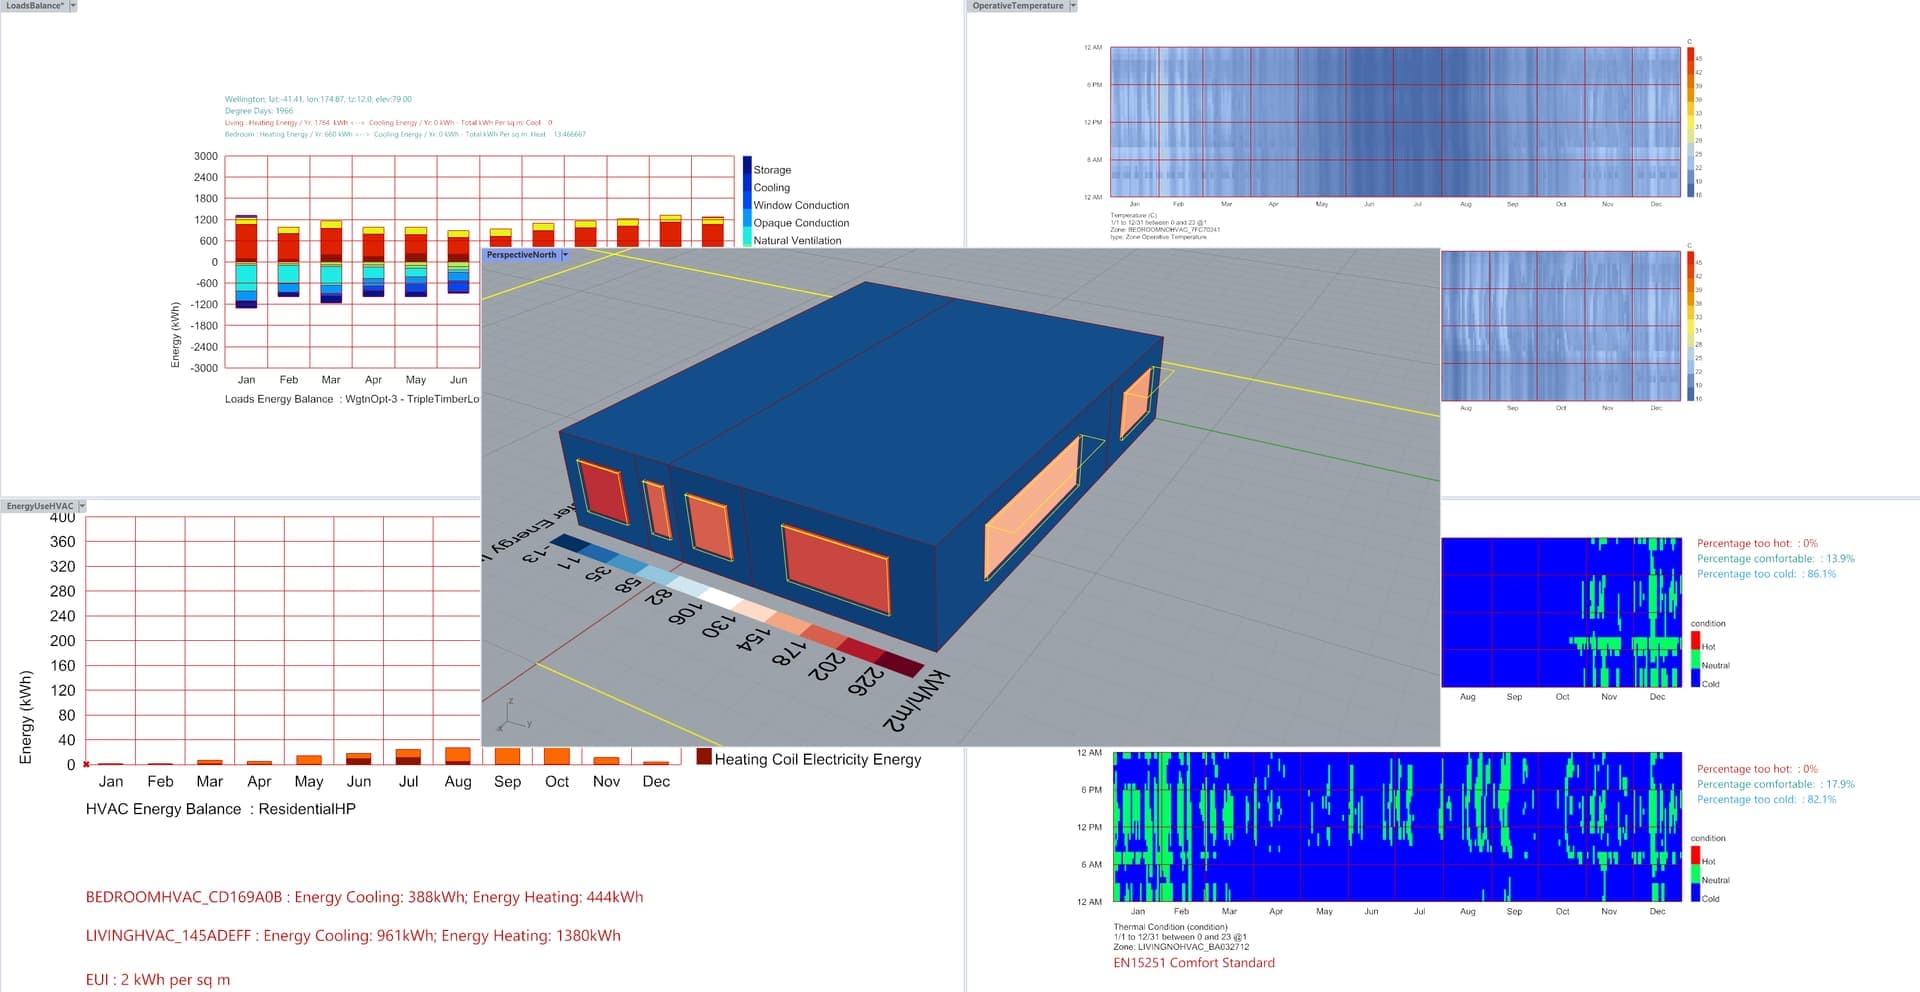
Even though the option selected is for Queenstown,

the Load Balance graph associated with this data is clearly, from the documentation built-into the script, Auckland:

Any assistance / suggestions gratefully welcomed.
#ladybug-tools #colibri #scripting #images
