3D Form finding with Kangaroo 2

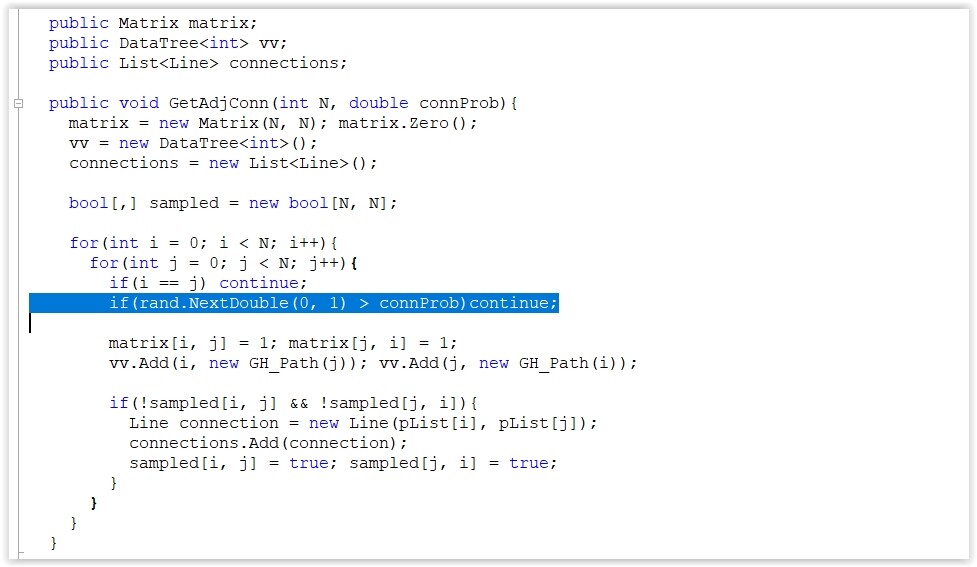
Hi. I have a project that I believe can be solved with Kangaroo 2 in Grasshopper. I’m trying to create a bunch of neuron-like nodes that self organize. I’ve made a binary spreadsheet that indicates whether a point is connected to another point.

For example: point A connects to point B, point A connects to point C, point A does not connect to point D, point A connects to point E. And point B connects to point A, point B does not connect to point C, point B does not connect to point D, point B connects to point E, etc.

It’s about 1000 points and clearly less connections. However, my points are pretty random and so are their connections. I was hoping to draw a springy line between each connecting point with Kangaroo and have them self organize themselves. I was also hoping to add some sort of repelling force between each point so they spread out as much as possible in a 3D space.

That’s what I’m trying to do.

Issues I’m having right now are:

  1. figuring out how to import my binary spreadsheet so I don’t have to manually build each connection.
  2. finding how to make my points so they aren’t anchored
  3. finding how to connect the points with springy lines. (1in lines with 5in of play)
  4. pressing “go” and having the points and lines self organize (points should be closer to other points that they are connected to. The more connections a point has the more stable it should be and the less connections a point has the further out it can be… this is where things get pretty fuzzy in my mind)

I imagine I’ll probably need to write a python script at some point but if I can avoid it that would be amazing!

Does anyone have any idea on where I could start? Thank you in advance for any hints or suggestions since I’m kinda not sure where to even start.

1 Like

This is what my binary table looks like

In fact you have a Graph.

Your binary table is called adjacency Matrix (representable either by a Matrix or a DataTree). Kinda what the proximity native component does but somehow “inverse”. In fact we are talking about connectivity: for instance (case Tree) each branch is the index of Point in your List and the items indices are the indices of the adjacent points in the same List: this is called VV connectivity (V for Vertex) and is more or less the same with meshes/breps etc.

Using the Matrix/DT you can connect the points rather easily (avoiding duplicates since the Matrix is symmetric : every Matrix[r,c] cell equals Matrix[c.r]) and thus define “springs” for K2. The only thing remaining is the rules/Goals: for instance get the max connection length and define a Goal where K2 is trying to “equalize” the rest. In order to avoid points lost in space (or to keep them within some rational/reasonable boundary) you should use some other Goal as well: for instance their containment in some max “boundary” Topology, plastic Anchors (meaning: don’t go away too much), some sort of relation to “focus” points etc etc.

That said is possible to have islands in your Graph … but let’s forget that part for the moment (rather impossible to do it without code and dealing solely with the VV connectivity).

After all the above you can add some visual drama to your “relaxed” (post K2) Graph via various ways/add-ons (TSplines used [dead but alive] in this case - but there’s ExoW, Dendro and Daniel’s stuff as well around):

If you are a true coding freak … well … you can do a Stainer Graph out of your points (but that’s only for freaks, he he).

Or an inverse Steiner (only for freaks etc etc):

3 Likes

Hi @ckay

As Peter says, your spreadsheet is expressing a graph as an adjacency matrix.
I think the easiest way to import this without any scripting is to save your spreadsheet as a .csv file.
This format is very simple and can be processed using the string components in Grasshopper like the definition below.
It splits the text and checks which cells contain an ‘x’, and culls the connections between the points according to this, then adds a zero length spring between all the ones which are connected to attract them, and collisions between all points to keep them apart.
Remember to watch out for connections between a point and itself, which would be entries along the main diagonal, and duplicate connections, which would be entries on opposite sides of the diagonal.
You could either remove these in your spreadsheet, or check for them in the Grasshopper definition.
Also if the last row in your table is empty, you might need to add an extra row of commas.
image


readCSV.gh (12.6 KB)
values.csv (34 Bytes)

1 Like

Well … the 1M question is why our friend use that way to define the random (or other) VV connectivity. Meaning that - maybe - if we want to skip reverse engineering … the straight/simplest way to do that is to create the Matrix (or the DataTree) inside GH.

Unless there’s some other kind of app used that outputs the adjacency via Excel.

I agree - if setting the adjacencies directly in GH is an option, it will be easier.

How would that be easier in GH than on a spreadsheet?

I mean if which of the pairs of points are connected is just random, then creating these random connections starting in Grasshopper will be simpler than putting random values in a spreadsheet then importing and processing this spreadsheet.

1 Like

Indeed.

BTW: Found a couple of minutes for some abstract entry level/simple demo (rnd pts + rnd connections and then Daniel takes control blah, blah).

Goals used : plastic Anchors and equal to average Length connections - obvioulsy others are more than possible and/or reasonable.

PS: Not included: graph VV island detection and various post K2 things: prior/after pair tracking etc etc.

Points_RandomInBoxAndRandomAdjacencyRelaxK2_V1.gh (123.1 KB)

Totally agree. Random seems like it would be WAY easier but unfortunately, these connections aren’t exactly random… They just seem random. So, I’m kinda locked into using the spreadsheet method. I’m really going to have to re-read these comments a few times since I’m still pretty new to GH (9months in) and a lot of that seemed a little over my head.

Oh wow. These images look super dope. I’m going to sit down and try laying this out tonight. Might take me… A while. Thanks so much for the input!!

Well … explain here explicitly the logic used and cross fingers.

BTW: See the provided - just for fun - C# demo above. I could easily implement your rules (if they are clear) … but is a black box if you are not familiar with C#.

BTW: Adding “thickness” (and some “liquid” look) to a Graph is NOT real-time and may you’ll need various ominous (and costly) things like fast CPU (and the rest), fast GPU, // proccessing, lot’s of Karma etc etc

BTW: Thread title is wrong: this is not form finding … is Graph relaxation via K2.

Found a couple of minutes more for the trad update:

A 2nd rnd connections mode is added (using a classic RTree search - spot the 2 yellow help circles related with search min/max radii) that yields far better looking graphs (but this maybe is not your concern at all). That said random points geared to random connections (by index) is a bit LOL/pointless - even as a demo.

Plus: 4 options for the target connection length are added:

Points_RandomInBoxAndRandomAdjacencyRelaxK2_V2.gh (123.4 KB)

BTW: I can barely see any reason to use a spreadsheet for your adjacency Matrix (or Tree or bool array [ , ]) . Is kinda flying from DC to NY via LA. Even if you want to do this interactively o a per “cell” basis (storing volatile data to persistent per “call” and using them as the new input for the next desired value OR remove/modify any previous one OR recall some other combo [history of attempts]… etc etc) there’s easy ways to do that via C#.

I do hope that you know how to reference the K2 dll

1 Like

Ah. I really wasn’t too sure what to name the title so I chose the thing closest to what may have been best. But now I know Graph Relaxation via K2 is a better option. Thank you. Also, I’m still poking around the K2 solver but I’m super new to this so it looks like it’ll take some time to understand. Thank you so much for the updated (upgraded?) response to my original question. I’ll post something more substantial once I get something tangible. I shouldn’t have GPU issues once things are processing… hopefully. My Karma should also be in good standing since I fed those homeless kittens this morning. :grin:

I have 16 cats, 5 dogs and at least 100+ homeless animals around home that need and receive care/treatment (plus actions for adoption).

Meaning that since we share the very same passion … well … you have my full attention from now on.

BTW: If we forget the island detection part of the story (rather critical in Graphs) the 2nd option in the update … well … can yield “nice looking Graphs” (if this means anything to you) that could yield “nice looking liquid things” (ditto).

Plan Z: fake things (connections, that is) entirely and do a WOW liquid Graph interactively (as briefly explained above). That’s quite complex to explain in depth, mind.

Thanks for all this! You’ve definitely thrown a lot my way. I’m currently learning more about data trees with this video:
Grasshopper Basics: Understanding Data Trees - YouTube
and will go through everything step by step. Might take me some time but I’ll 100% get back to this thread and let you all know how things are going when I’ve made some progress. Thanks again!!!

I doupt that this is the right way to walk that walk. Anyway keep in mind that a DT is a (custom to GH) way to manage Lists. Should I say a “Dictionary of Lists”? Not quite … but you get the gist I do hope.

Note: managing DT’s via code (notably in complex cases) is at least 1000 times easier than via components (for any imaginable task: mild, wild, sane, insane etc etc).

Keep feeding the kittens and watch the Magnesium percentage (should be around the 0.07% mark or lower). Learn how to vaccinate them (DIY) as well.

Hmm… I’m just trying to get a handle on how to import my data correctly. You mentioned data trees before so I went that direction. Is there a more specific way you are thinking?

DO NOT use a spreadsheet for your connections: is 100% pointless. How much pointless? well … like trying to tune a Harley Davidson. DO it directly using some rules and a Data Tree (why bother?), a Matrix (hmm) or a bool[ , ] Array (yes).

Let’s forget the DataTree option.

If you need to visualize your adjacency status (solely for tests and the likes) then use a Matrix. This is the most “compact” way to see what’s happening … but is 100% useless if you have a zillion points/nodes (in fact more than, say, 50). But ALWAYS test something many times before … blah, blah.

So the best and fastest way is to use a bool [ , ] Array. when you define this it would (by default) be a collection of false values. Kinda using the Matrix.Zero() Method.

So (remember that adjacency is symmetric):

bool [ , ] adjArray = new bool [items, items]; // all false (items: your pts count)

for(int i = 0; i<items;i++){
for(int j =i+1; j<items; j++){
// DoConnection is some Method that tells you that i, j (and j,i) should connect. Could be random (stupid) or smart or simple or complex or LOL. Is your responsibility to define proper rules (hopefully not bananas).
if(DoConnection(i,j)){ adjArray[i,j] = true; adjArray[j,i] = true;}
}
}

BTW: A “similar” approach is used in the 1st C# (option: random connections acc a random probability naive/stupid user value/rule):

BTW: obviously the pro way to cut the mustard is to define a custom Class where suitable properties are assosiated to each Point and thus the DoConnection (i.e. connect) would deal with some pragmatic rules for declaring a connection as valid. If your points are male and female then, say, use for Properties: an IsFemale bool, plus an HowPrettyIsShe int , plus an IsMarried bool , plus an DoesSheLivesInThisPlanet bool, plus WhatBikeSheRides string … blah, blah).

BTW: Since the Graph part is solved (and the K2 as well - we can add/use any Goal imaginable [existed or custom for the occasion]) … post here your rules (or some rules). This is the core of the matter … the rest are elementary.