Mathematically speaking the normal, principle, mean, min and max curvatures can be positive or negative numbers and the sign depends on the choice of unit surface normal. That is these numbers are not a property of the surface by itself , but are a property of the surface together with an orientation ( choice of which side is the “top” if you will). So if you have a surface and you “flip the normal” of the surface all of these curvature values change sign.
Notice, the Gaussian curvature is independent of a choice of normal since it is defined as the product of the principle curvatures. So when the normal is flipped both principle curvatures change signs but the sign of the product is unaffected.
So all I can guess is that we thought it would be less confusing if we just reported the absolute value of these curvatures so that the result did not depend on a surface orientation.
I understand the approach you took on that. This is also expressed in the Rhino Help: Displays the absolute value of the mean curvature. It is useful for finding areas of abrupt change in the surface curvature.
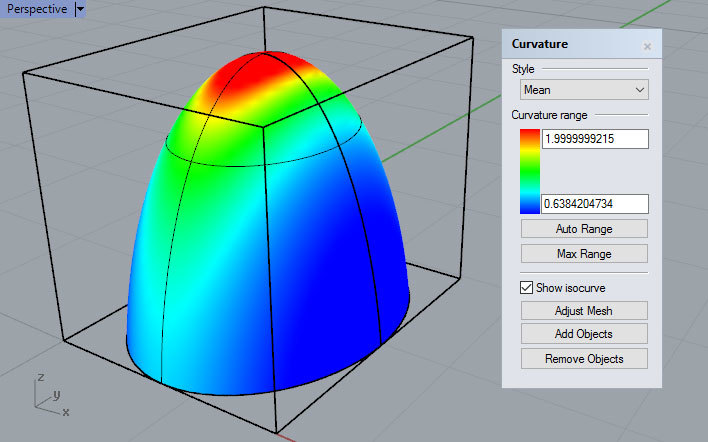
Unfortunately this only works well on synclastic surfaces i.e. where the Gaussian curvature is positive at any point on the surface. Like shown here on this ellipsoid:
But if you inspect the mean curvature on an anticlastic surface (overall negative Gaussian curvature) like the hyperbolic surface below, then it appears that the center of the surface has no curvature, while the edges (which are actually the least curvy areas) are shown in red.
Mathematically this is correct in a sense of mean curvature (edit: more or less: red should be negative), but it does not help me to find the areas with most change of the surface curvature like indicated in the help file.
Really confusing it gets on a surface with mixed positive and negative curvature.
I think the best way out of this dilemma is to display the Mean Curvature like David has shown in his linked post.
Additional you may invent a curvature analysis which supports the initial idea and displays the amount of change of curvature – but this can be tricky
I don’t know what “areas with most change of the surface curvature” means to you, but the help file says mean curvature helps locate areas of abrupt change of curvature. I assume that means that when the color bands are close together that indicates rapid changes in curvature. If the color bands are spread out evenly (as in your example) then the surface has no abrupt changes. In other words, if the red and blue are close together that is an indication of more abrupt change while red and blue far apart is an indication of smoother curvature change. This is a rough indication of how well behaved a surface is. Many Rhino commands work better when they are fed surfaces that are well-behaved (i.e. don’t have abrupt curvature changes).
In your example surface the absolute value of zero is still going to be zero and the pattern of the display will still be the same if negative values were included. What you would see if the full range was shown is a green x shape in the middle and there would be red in one set of diagonal corners and blue in the other (depending on surface normal direction)
Its also worth noting that Max and Min are always positive because they are showing radius not curvature. Reporting the Max and Min radius values is far more useful than showing the curvature values.
@jess I disagree with your interpretation AnticlasticSrf.jpg:
The blue areas have no mean curvature. More precisely, the mean curvature is near zero in these areas. Conversely, the red areas are the areas with largest mean curvature ( of course meaning largest in absolute value). The information we are missing is wether the red areas have mean curvature of the same sign or opposite sign.
I do not understand what a designer is looking for when looking at mean curvature. Seems to me If one is interested in anticlastic vs synclastic characteristics then Gausian curvature is the right tool and mean curvature is the wrong tool.
I’m NOT saying that this would do a better job regarding what the help file says. It simply is showing the real mean curvature.
However, we know how to interpret the current implementation. But I know many users who simply do not understand the curvature analysis. I think this command needs some love…
Eventually they want to analyze where a surface is concave or convex?
At least I’ve never used Mean Curvature to find abrupt changes in the surface curvature. I can imagine cases where changes in the curvature might be cancelled by positive/negative curvature values. But I might be wrong…
Yes but the question is what is the value in showing the full range as opposed to the absolute value. The full range doesn’t really tell you much about the shape. A negative number can be the average of 2 negative numbers or the average of a positive and negative number.
You are using extreme examples to make your case. The only time I have found the mean curvature analysis useful is when trying to iron out subtle curvature irregularities. Mean curvature analysis can be useful in finding that one control point that is a bit out of place on an otherwise smooth surfaces. Often curvaturegraph is more useful in finding curvature irregularities but sometimes curvaturegraph won’t do the job as in your first surface example.
In order for it to be useful for that purpose the user would have to have a photographic memory of the Gaussian curvature image and the ability to overlay the user’s memory image over the mean curvature screen image. And even then you don’t know whether its concave or convex unless you have some prior knowledge of which way the surface normals point and how the normal direction affects the color scheme.
Thus realistically it would not be of much use to the typical user to visualize convex/concave areas.
You didn’t include any new pictures.
The 2 pics of signed mean curvature you previously sent do not accurately tell where the surfaces are concave and convex.
The red and blue do not accurately depict the region where the surface is convex and concave. And that is an extreme contrived example. On most surfaces the display will not even come that close to being accurate. In this example if you eyeball the surface in shaded mode you can determine where it is concave/convex with about the same amount of accuracy.
In the other picture which you posted of signed mean curvature none of that surface is purely concave or convex and yet it has areas of both red and blue.
The mean curvature display is by itself not going to tell you where the surface is convex or concave. Areas where the mean is positive could be areas where the principal curvature are both positive or it could be saddle shaped with one principal curvature positive and one negative. All you really know is the sum of the 2 is positive you don’t know in what area they might be both positive.
And to make this concavity test even more unreliable if you flipped the surface normals the red and blue would become reversed.