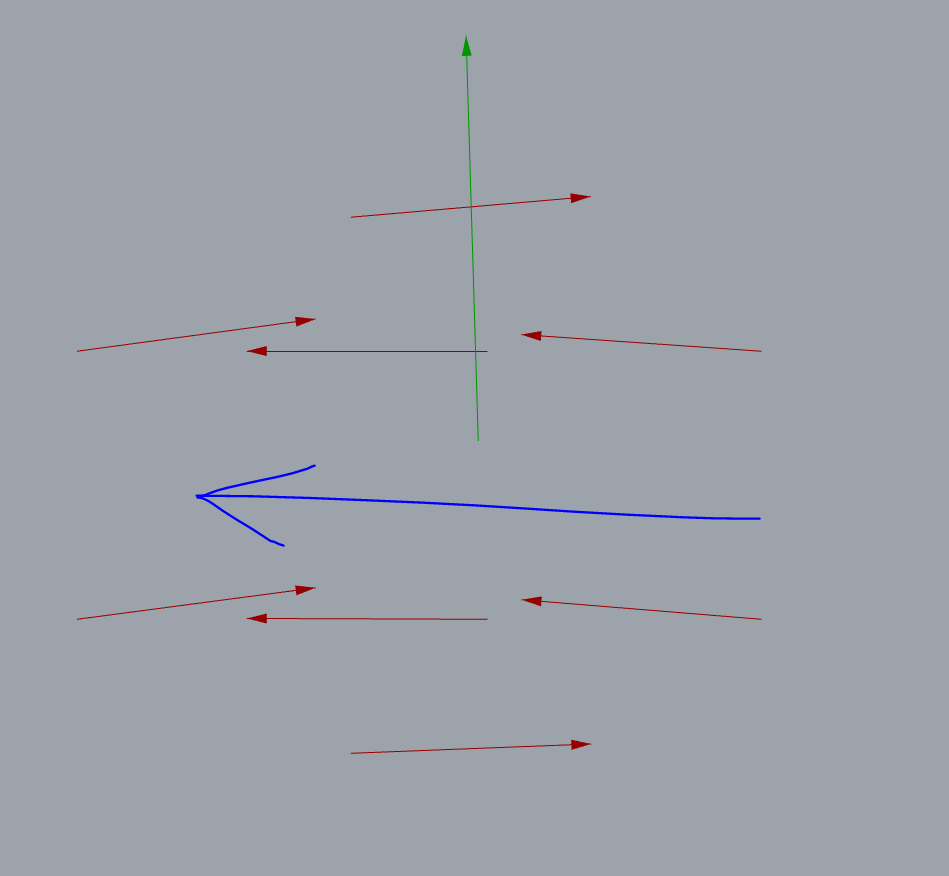
maybe a quick answer for a quick question. When I do an average of the red vectors I got that green one. But what I want to have is that blue vector. I think i have a mathematical misunderstanding of how I can get there. 200113_Vectorlines.gh (9.6 KB)
Any help? Thanks!
i think i have to specify my problem: I have a bunch of vectors and points. The result should be that the lines are in harmonic grid. Here you can see that some Lines are unharmonic due to the earlier problem: 200113_Vectorlines_Var2.gh (19.8 KB)
Are you looking for something like Principal Component Analysis? (good explanation of PCA here)
One easy way to approximate this in GH is to take the vector for each line and its negative and plot it as a point, then fit a line through these points. fitline.gh (17.0 KB)
Thanks Daniel,
I’m not sure if i understand how fitline solves that problem. But it does it pretty good!
And that forum about PCA looks interesting. Thanks for sharing.
Hendrik
To try and clarify why I used FitLine here-
If you have the 3 red vectors and take their average, you get the result in green, because one of the inputs points is almost the opposite direction to the other two, so they partially cancel out:
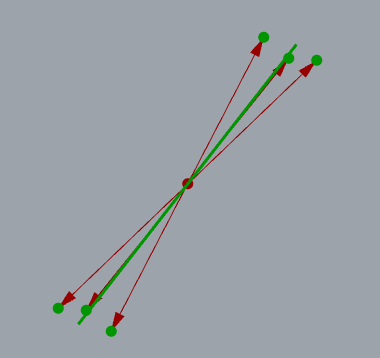
If instead for each of the input vectors, you place a point at its end, and also at the end of the reversed vector, you can fit a line like this:
The advantage of this over choosing one of the vectors or a global direction and flipping the input vectors based on their sign relative to this is that there there’s always a chance you get unlucky and the flipping reference vector ends up being nearly perpendicular to the other inputs so the original problem still occurs.