Hallo,
I am using a visualization plug-in called Conduit. And I want to create a bar chart with 2 values but the second value is not showing in the bar chart unless I add another value.
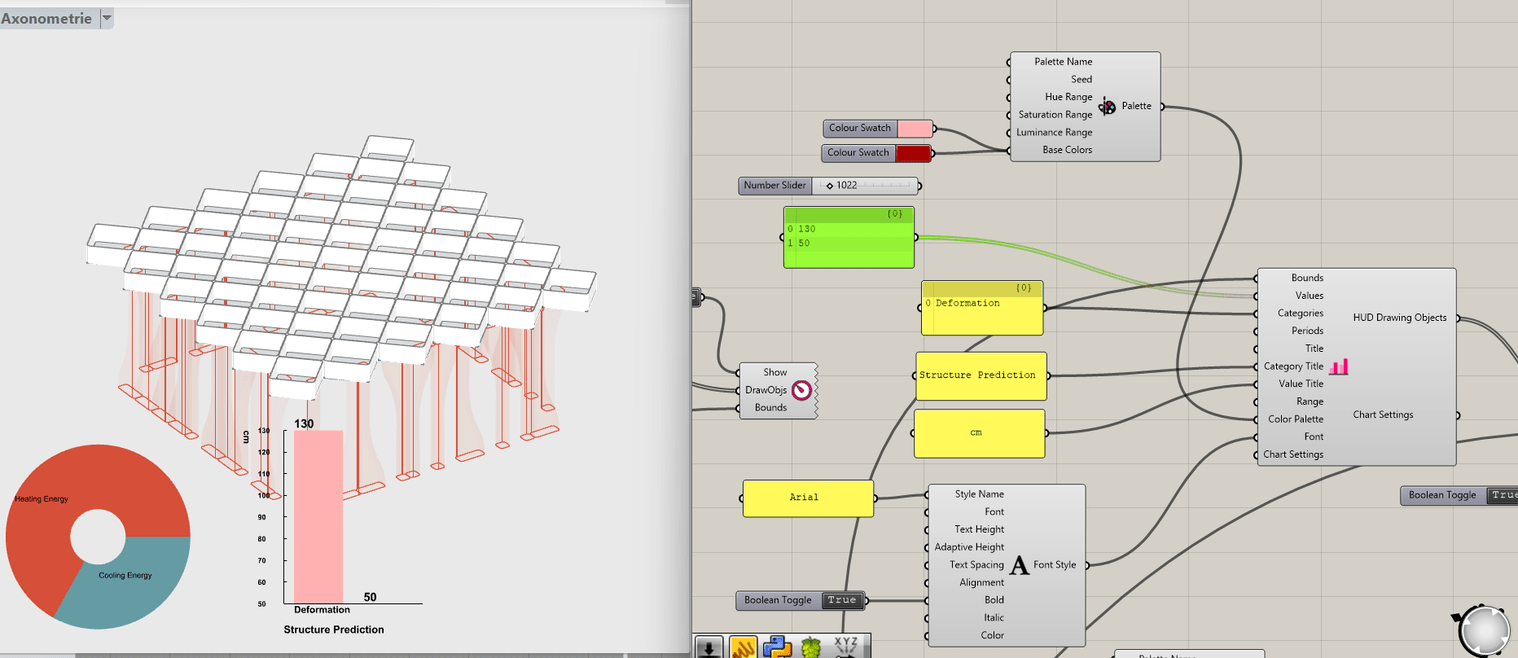
Here’s the screenshot of the script:

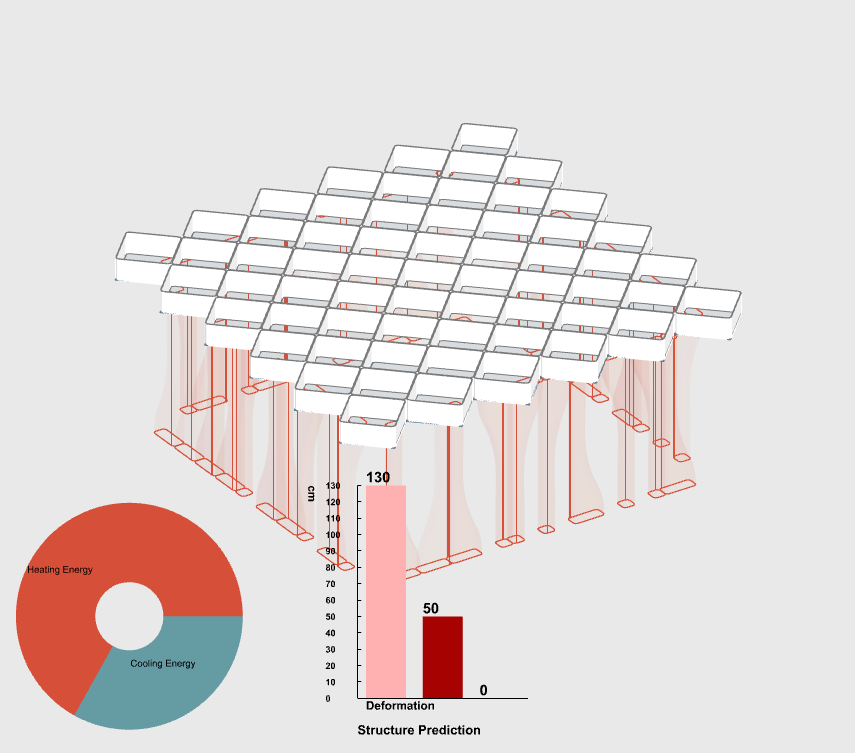
I would like to only have 2 bars with 2 values but if I don’t add a third value which is the 0 value, the second value with 50 will not show.
This is what it looks like if I only input 2 values (screenshot below). The 50 value will be considered as 0.
Anyone has any idea to fix this?
Thank you!
Cheers,
Felita