When I first started to learn Rhino more seriously (a few month ago) the CurvatureGraphs always looked so smooth, even when curves were visibly “bumpy”. The graph remained relatively smooth (rounded outer edges) even when I adjusted it in different ways as to show meaningful resolutions, aso.
But recently I started to see only very “thorny” graphs. It doesn’t seem to matter how I go about trying to smooth the curves out, the graphs are still thorny, spiky and disrupted.
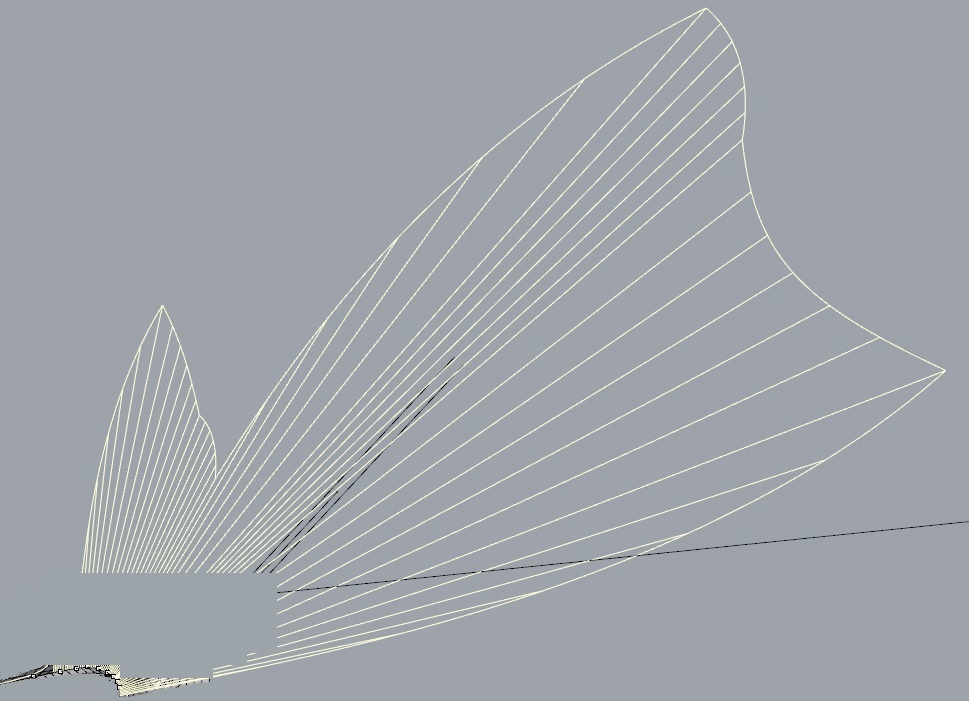
The curves in the picture has degree 3, geometry irrelevant (not my model) just illustrating the “thorny” & spikyness).
Q: What is the typical cause for curvature graphs being “thorny” rather than having smooth transitions even when curves are obviously bumpy? Settings, or manipulations of the curves forcing them to become “thorny”, or something else?
Hi Rolf - hard corners in the graph are discontinuities in the rate of change of curvature. Graphs like the one you show are often from more complex curves, such as projected curves, or trimmed edge curves or refit curves . My guess is that this curve is quite dense - in many cases the shape can be drawn with a simpler curve, but of course, not always…
Keep in mind that the scale matters - even small g3 discontinuities can be blown up to look dramatic with a high enough scale on the graph.
Then I understand why my curves became thorny (have to make complex support geometries in order to derive my final curves, often ending up with slight rate change" discontinuities.
Is there any simple fix for the “rate change” discontinuities? I’ve tried like FitCrv etc, but to no significant avail.
Hi Rolf, I think this depends on the degree of the curve. Curves with degree 2 don’t have curvature continuity, so the curvature graph will break, higher degree numbers like 3 or 5 should give a better continuity in curvature. What degree is your curve? What happens if you run ChangeDegree command with deformable set to yes and put a higher number?
Hi mire,
The degree in the pictured graph is 3 (not my model though), but I have other curves like that in my own models.
I have tried just that (changing the degree, to 3 or 5), but that doesn’t help. As pascal pointed out, the structure is disrupted somehow (the distribution or distance between between the ControlPoints?).
I have tried different things, but have not been very sucessful in fully healing such spiky curves.
For the future I hope to find ways to deal with this problem. Best of course would be to avoid it to occur in the first place, but certain workflows simply ends up in such curves. For now I guess I will simply have to accept that it takes more experience to know in advance which workflows most likely will lead to these “bad quality” curves, and so I have reasons to explore different workflows as to avoiding the disruptions in the first place.
Yes, multispan is often the case, due to the need to have cuts where to attach perpendicular curves, then joining again, and then the “thorns” will disclose something about the history behind that curve…
(Wonder if the thorns disappear if merging (instead of joining) such curves, hm, why do I doubt it?)
Must find other ways to build up the “support” curves for building up network curves used for guiding surfaces,other than chopping them off like that.
Edit: Intersection POINTS
If the Intersection function would be able to set a point in the intersection between a surface and a curve, then the need for cuts would disappear. Haven’t seen that there’s any such Osnap either (unless I have missed it).