Would be nice to have something like this as an input tool…
Obviously my image is just and illustration. Programming something like this seems difficult.

i mean the gh part is simple only the ui i don’t know…
Would be nice to have something like this as an input tool…
Obviously my image is just and illustration. Programming something like this seems difficult.
i mean the gh part is simple only the ui i don’t know…
Hi @ajarindia,
this is not what i meant…
what i mean is for the user to be able to move those handles (as in the color wheel tool) and get the output

Oh, my mistake!!!.
Pie charts are pretty horrible though. It’s really hard to compare the size of segments between two discs if they are not in exactly the same place.
Still, as a way to divide up some unit amount into n segments I suppose it’s a decent approach.
What happens when you drag one of the grips though? Does it only affect the two adjacent segments?
Yes, the n segments idea would be decent.
When I drag one grip it affects all segments. I attached my userobject.
BC Values to Percent (with piechart)_1.ghuser (12.1 KB)
But now, that I partially have the definition and the graphics for it, how difficult is to make a component out of it?
7? On a scale of 1 to 10.
You’ll need to create a class which derives from GH_Param<GH_Number> and override its default attributes. All the hard work is done in the attributes, custom display, mouse handling, etc.
It’ll be a fair amount of work, but not too difficult if you’re comfortable with either VB or C#
Yes, sounds geeky. Why can’t we do grasshopper components with grasshopper?
Mostly because it would take me months to develop that, and partially because UI logic tends to involve lots and lots of conditionals and loops, and those are difficult to do in grasshopper components.
Yes, I miss loops a lot. I saw that there are several plugins that attempt this. Also simple loops can be done using ghpy.
Why this drawback?
A good example of this is VVVV, which is mainly used for loops because it is oriented towards media production.
Maybe loops and conditionals are more easy to express in text after-all…
If you know how, then undoubtedly.
Well I’ve been doing loops with ghpython but i have to say it requires some practice. Sometimes it’s tricky even though the principles seem easy.
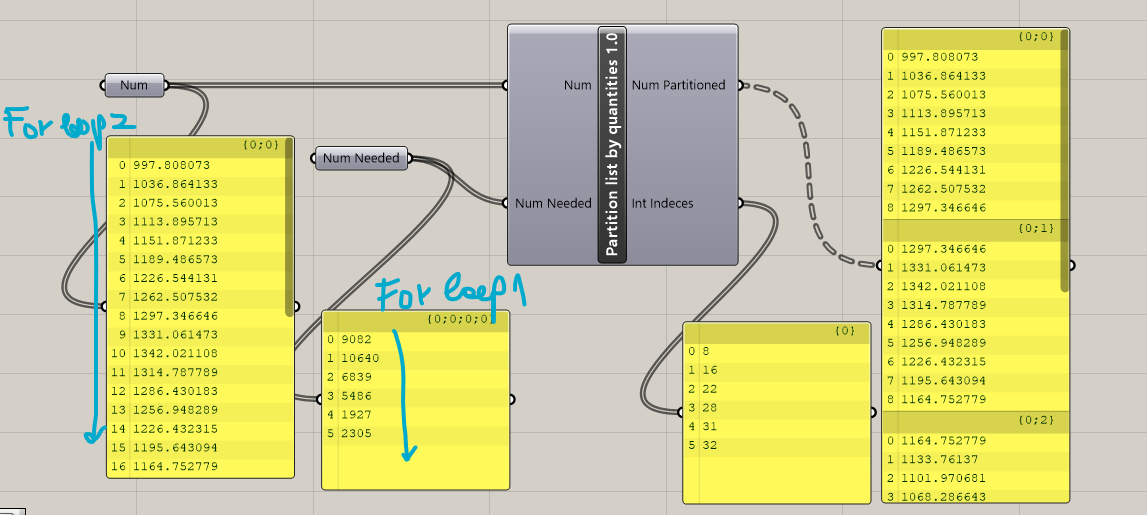
Here’s an example of a for loop I was working on today. It iterates trough a list of numbers summing them one by one until the sum reaches another number from a second list. When this happens all the numbers are added in a sublist and i also get the indices where the initial list was partitioned.
And the code for this:
__author__ = "bogdan"
__version__ = "2020.09.17"

import rhinoscriptsyntax as rs
import ghpythonlib.treehelpers as th

new_area_list = []
indeces = []
i=0


for j in range(len(areas_needed)):
    new_areas = []

    for i in range(i,len(areas)):
        new_areas.append(areas[i])
        if sum(new_areas) > areas_needed[j]:
            break
    print sum(new_areas)
    print i
    indeces.append(i)
    new_area_list.append(new_areas)

areas = th.list_to_tree(new_area_list)
indeces = th.list_to_tree(indeces)
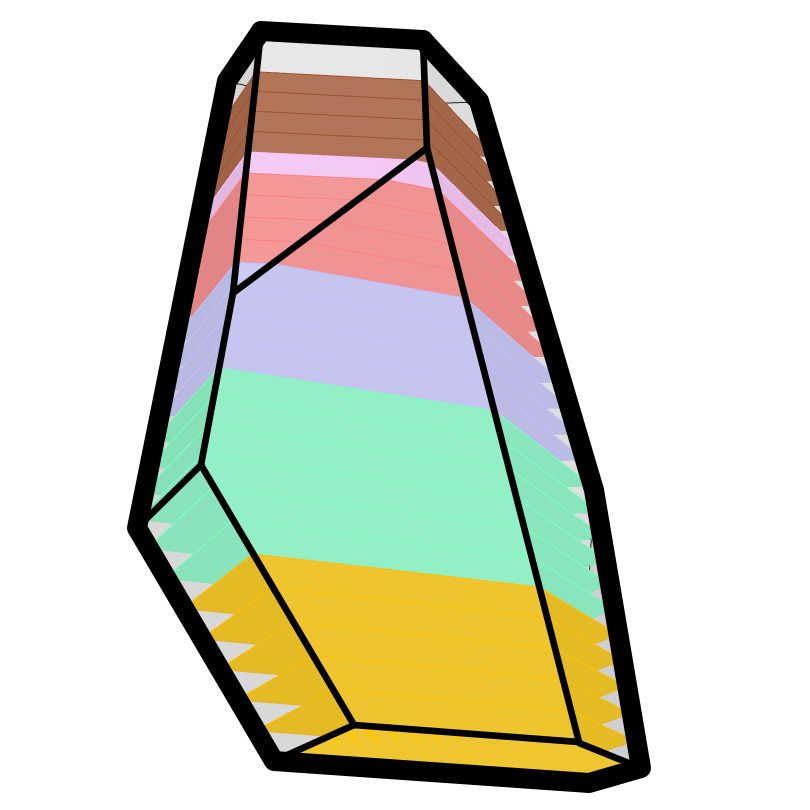
to be used for program distribution in volumes:
and I have also a nice diagram for it…