Interpolate curve through points in data tree

missing

Not very inviting… I didn’t bother looking at the original file.

Here is a variation on your version ‘02’:


interpolate_spiral_points_2022Nov2a.gh (10.2 KB)

P.S. Here’s another idea, a little goofball… Slider in blue group sets ± rotation increment.


interpolate_spiral_points_2022Nov2b.gh (9.8 KB)

2 Likes

Hi Guys,

Thanks for the responses.

I could get the relative item to work with the ‘line’ command, but it still doesn’t interpolate the curve because it isn’t restructuring/remapping the points.

(I know there are other ways of achieving the form and getting the points, but my points come from panels on a surface lofted from two circles, so I have to work with the structure I have currently. And yes, there are a lot of irrelevant GIS components I had been playing around with in this file)

What I am really trying to do is get items from a tree in this pattern:
{a}(0),{b}(1),{c}(2),{d}(3),{e}(4),{f}(5),{g}(6),{h}(7),{I}(8) - interpolated curve through points
{b}(0),{c}(1),{d}(2),{e}(3),{f}(4),{g}(5),{h}(6),{i}(7),{k}(8)) - interpolated curve through points
{c}(0),{d}(1),{e}(2),{f}(3),{g}(4),{h}(5),{i}(6),{k}(7),{L}(8)) - interpolated curve through points
Etc…

That should allow me to select the points in the correct sequence. I’m sure there is a way of telling grasshopper to grab items in this pattern (and Ideally restructuring the data), I just don’t know how.

Do you intend to wait for someone who has all your plugins? Or present a file that all of us can see?

See suggestion #3 on this page:

3. Attach minimal versions of all the relevant files

1 Like

Hi Joseph,

Never new about the internalize data command before. Thanks.

This copy shouldn’t have any components that require plugins

What copy? No file included in your post.

1 Like

GlassPavillionForumHelp.gh (145.2 KB)

Try again. This file is useless.
Not that I’ll be the one to help you… but this is the best way to get help.

missing

@Nicholas_Holt
I’m Not Sure if I Understand your intention correctly, But I Guess you can overlook the data management complexities and solve your issue with geometrical approach like this:


Interpolate-Crv.gh (9.4 KB)

I found that adding an integer slider (24) to the Partition ‘S’ input looks useful?

Have you Consider Flatten the data tree before “join curve” command?

1 Like

This looks clumsy to me, more complicated than necessary?


interpolate_spiral_points_2022Nov2c.gh (62.2 KB)

2 Likes

Hey guys,

Thank you for the help, and all of the solutions. And Joseph_Oster, I totally forgot that I was moving my data in Elefront components. Sorry about that.

But yeah, Joseph, you totally figured it out. That’s exactly the result I was trying (and failing) to get. Sorry you had to deconstruct the brep’s and start again. I think I’ve just about got my head around your solution and how you shifted the list data. This is a good lesson in managing data in trees.

I’ll try and come up with a less complicated solution and post it. Thank you again for helping me with this. Lots of gratitude to everyone that helped with solutions.

1 Like

Dear @Nicholas_Holt you probably didn’t even look at my examples in the first post. The line input is flattened because a branch gathers lines going straight up and not around in a spiral shape just yet. Flattening the tree is the easiest way to do this.

It seems you don’t know much about data trees. Therefore I’d suggest reading the modelab primer.

https://modelab.gitbooks.io/grasshopper-primer/content/1-foundations/1-5/0_designing-with-data-trees.html

1 Like

In addition to temporary text panels and the Point List component, these are the tools I use to visualize and understand data trees of geometry:
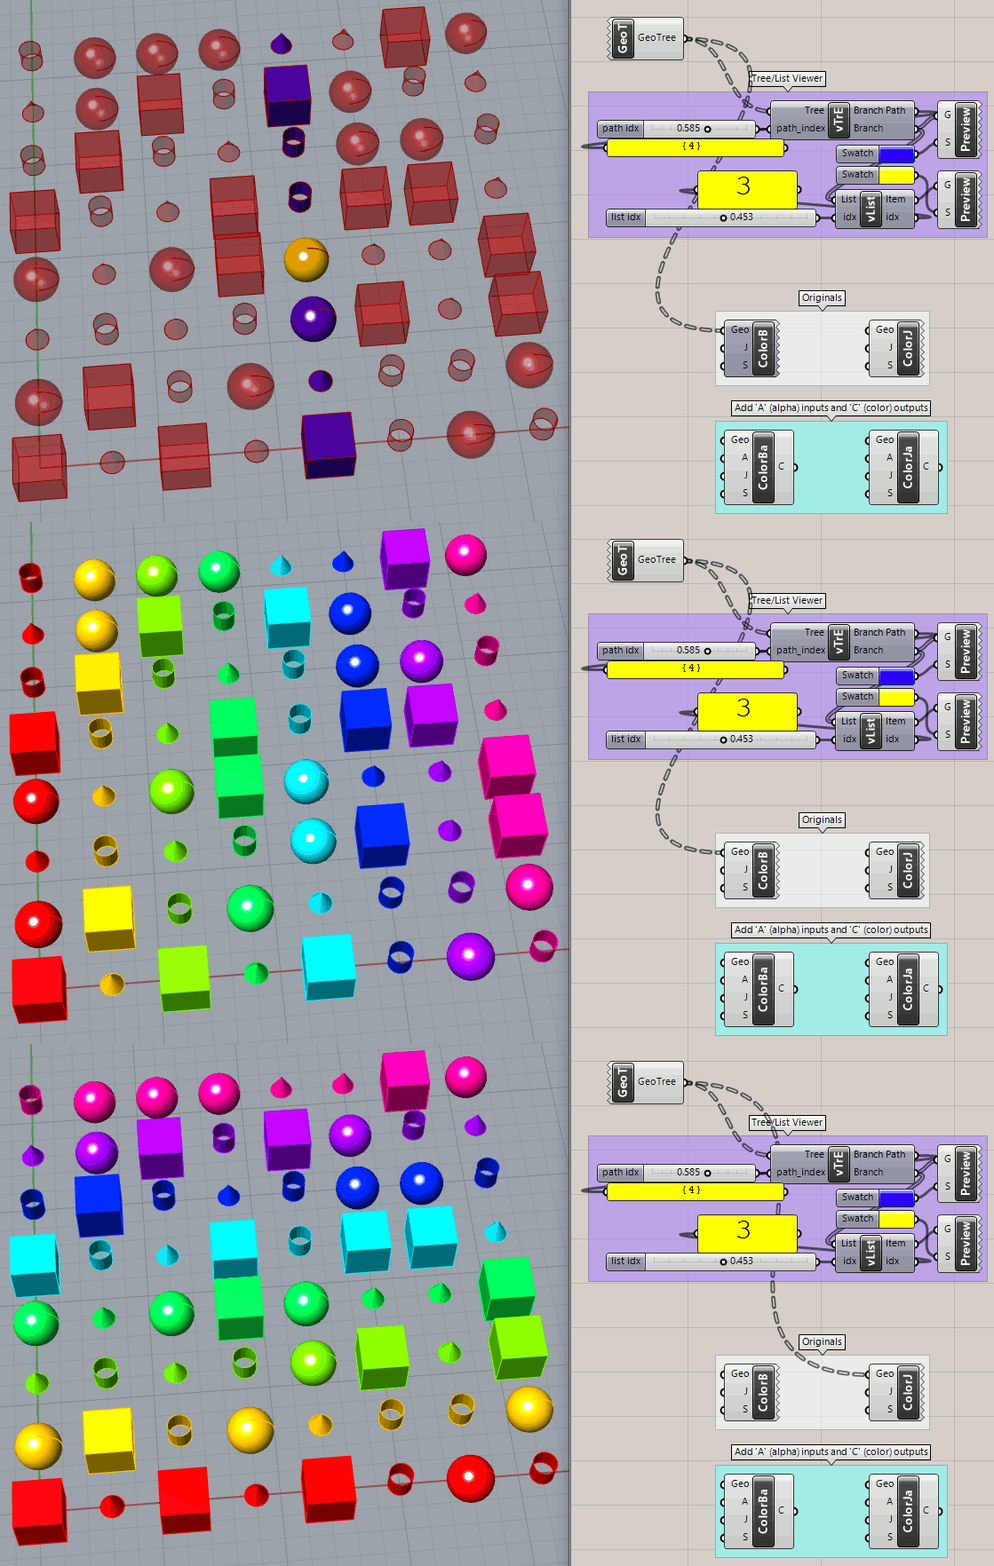
data_tree_tools_2022_Nov3a
data_tree_tools_2022_Nov3a.gh (46.6 KB)

Recently I added ‘A’ (alpha) inputs and ‘C’ (color) outputs to ColorB and ColorJ but I rarely need them or use them.

They tend to interfere with each other so I often use them one at a time.

1 Like

Hi Martin,

Sorry, I did try to flatten the data coming in but it crashed the RelativeItem component and I couldn’t get any data to come through it.

I had previously tried using ‘ListLength’ +1 to get the next item. However, I couldn’t make sense of how the RelativeItem component worked after the list was flattened and there were no branches left in it (i.e. there were no {n} branches to offset).

I am gonna give that ModeLab document a read. I have some sense of how the data is stored, but I don’t fully know what commands to use with what components to navigate my data. This was why I posted to the group, because I was definitely lacking some knopwledge.

Thanks Joseph. This is a great tool set. Definitely helps with visualizing data. Just gotta learn how to navigate it now.

Thanks Again

Flatten here, not the points of course :man_facepalming:

I can’t help wondering if there was useful data tree structure earlier in the process, when the panels were made, that would simplify the spirals? A significant complication was that panels on the innermost ring (at the top) have two points for the spirals instead of only one, like all the rest.