Hello all,
I am working on a Grasshopper script to analyse files prior to laser cutting. We have customers who send in files for laser cutting which are often poorly set up files. I am trying to create a script which will analyse each file and provide useful information about the file, and also highlight any problems. The files are 2D vector files, usually created in Illustrator or AutoCAD etc.
I am stuck on one particular part of the script: trying to highlight duplicate lines in the file. This is important so that the laser cutter does not cut the same line multiple times (wasting time and a potential fire hazard). I have a method which works well for simple duplicate lines, but it does not identify partially overlapping lines, nor nearly overlapping lines.
Ideally I would like to identify overlapping curves as well as straight lines, however 95% of the time the problem occurs with straight lines.
I would also like to identify lines which are close but not necessarily overlapping. Customers often arrange their files by hand so I need to identify anything approximately <1mm.
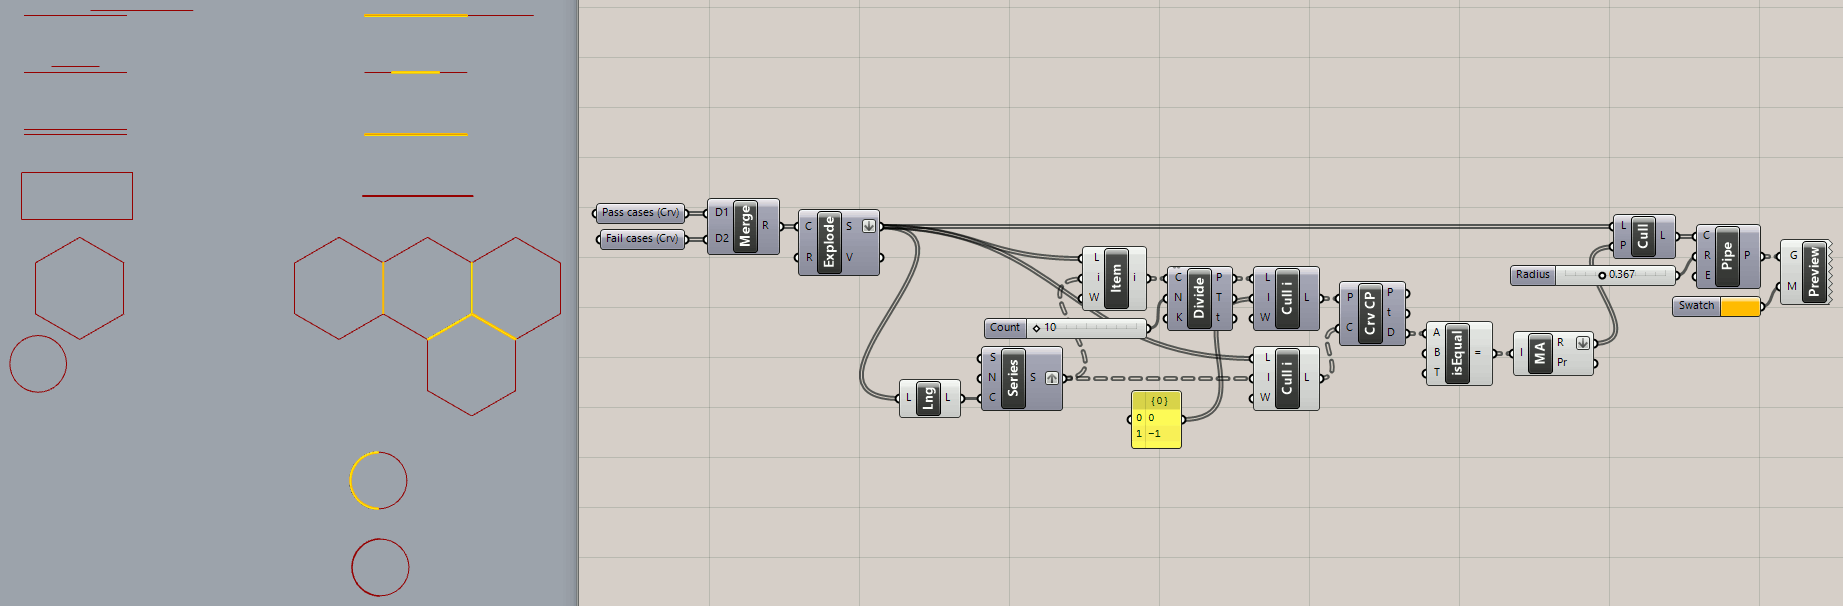
No plugins, curves are internalized in this model. Your geometry pipeline refers to the large rectangles surrounding your pass and fail cases, which I ignored.
I’m a little puzzled at how the result changes when the Divide ‘N’ (Count) value is raised or lowered…?
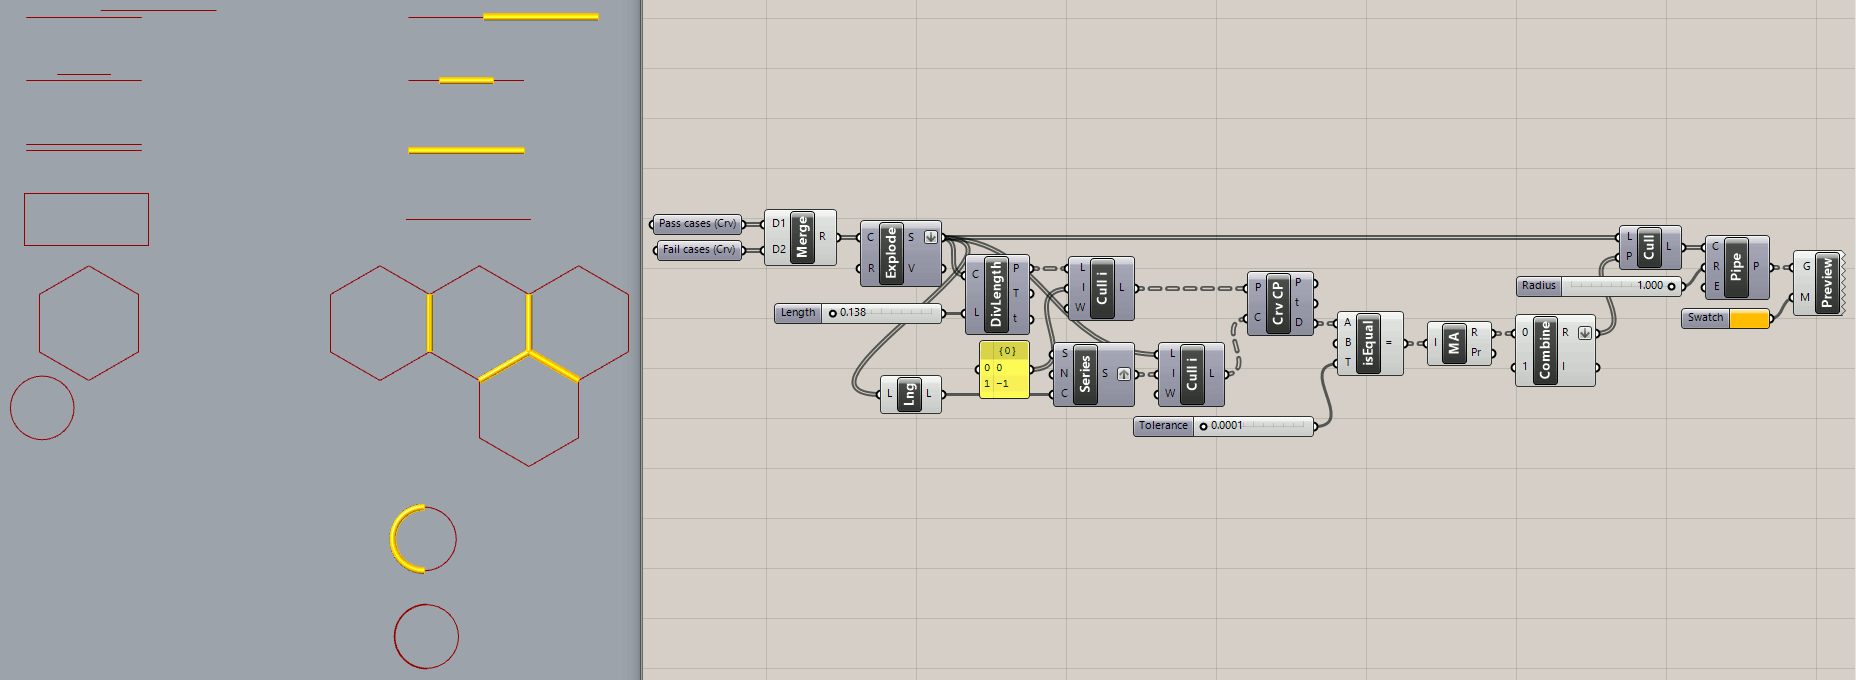
OK, I think this method is more definitive, though the results are a little hard to explain.
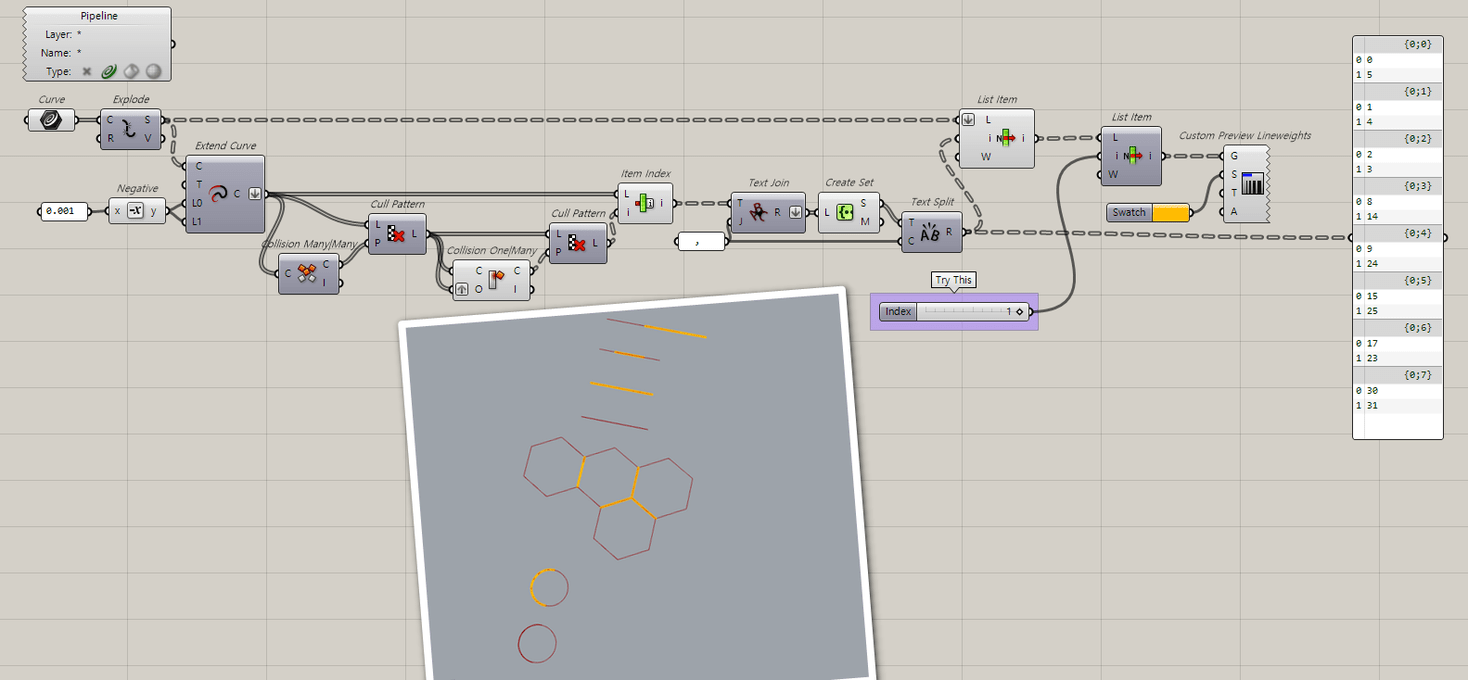
All curves that overlap another curve are piped. The text panel labeled ‘Overlap Index’ on the far right shows a data tree of index values where each branch (path) corresponds to one curve and the “list” of index values indicate which curve(s) it overlaps. Empty branches are curves that don’t overlap any others. All the overlapping curves in this test conflict with only one other curve, none overlap two or more. Examination by other means confirms that so a different test set is needed.
The ‘Tolerance’ slider in my model addresses this issue of curves that are close together but don’t overlap. This also highlights a (deliberate) quirk in my code that ensures all curves have at least one point to compare, no matter how short and regardless of the ‘resolution’ slider value.
So if you increase ‘Tolerance’ to 0.0530, two additional “overlapped” curves appear, 52 and 54. This is because both are that close to the midpoint of the very short curves that connect them, 51 and 53.
When you increase the ‘Tolerance’ to 0.1075 (slightly beyond the slider range as posted), 52 and 54 also appear in this table as overlapping each other:
As usual, I’m using my ‘Tree/List Viewer’ tool to examine and identify the curves by index value:
P.S. By the way, notice that curves 51 and 53 are not identified as being overlapped. That’s because the ‘resolution’ slider value is set too high, causing the first and last points on 52 and 54 to be too far away from 51 and 53. Reducing ‘resolution’ to 0.1 will cause 51 and 53 to appear (and be piped) but also increases the number of points from Crv CP to 758K (!!).