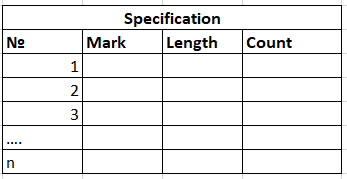
I more or less understand the logic of generating the grid of lines as a table, but I’m having trouble with the text generation (I don’t know the best way to do it). The idea is that this component should take as input a list of beam lengths (each element an integer or a float), the number of beams of each length (each an integer), the point at which to place the table in Rhino, the column widths, and the text height.
I tried to do something, but the code is throwing an error.
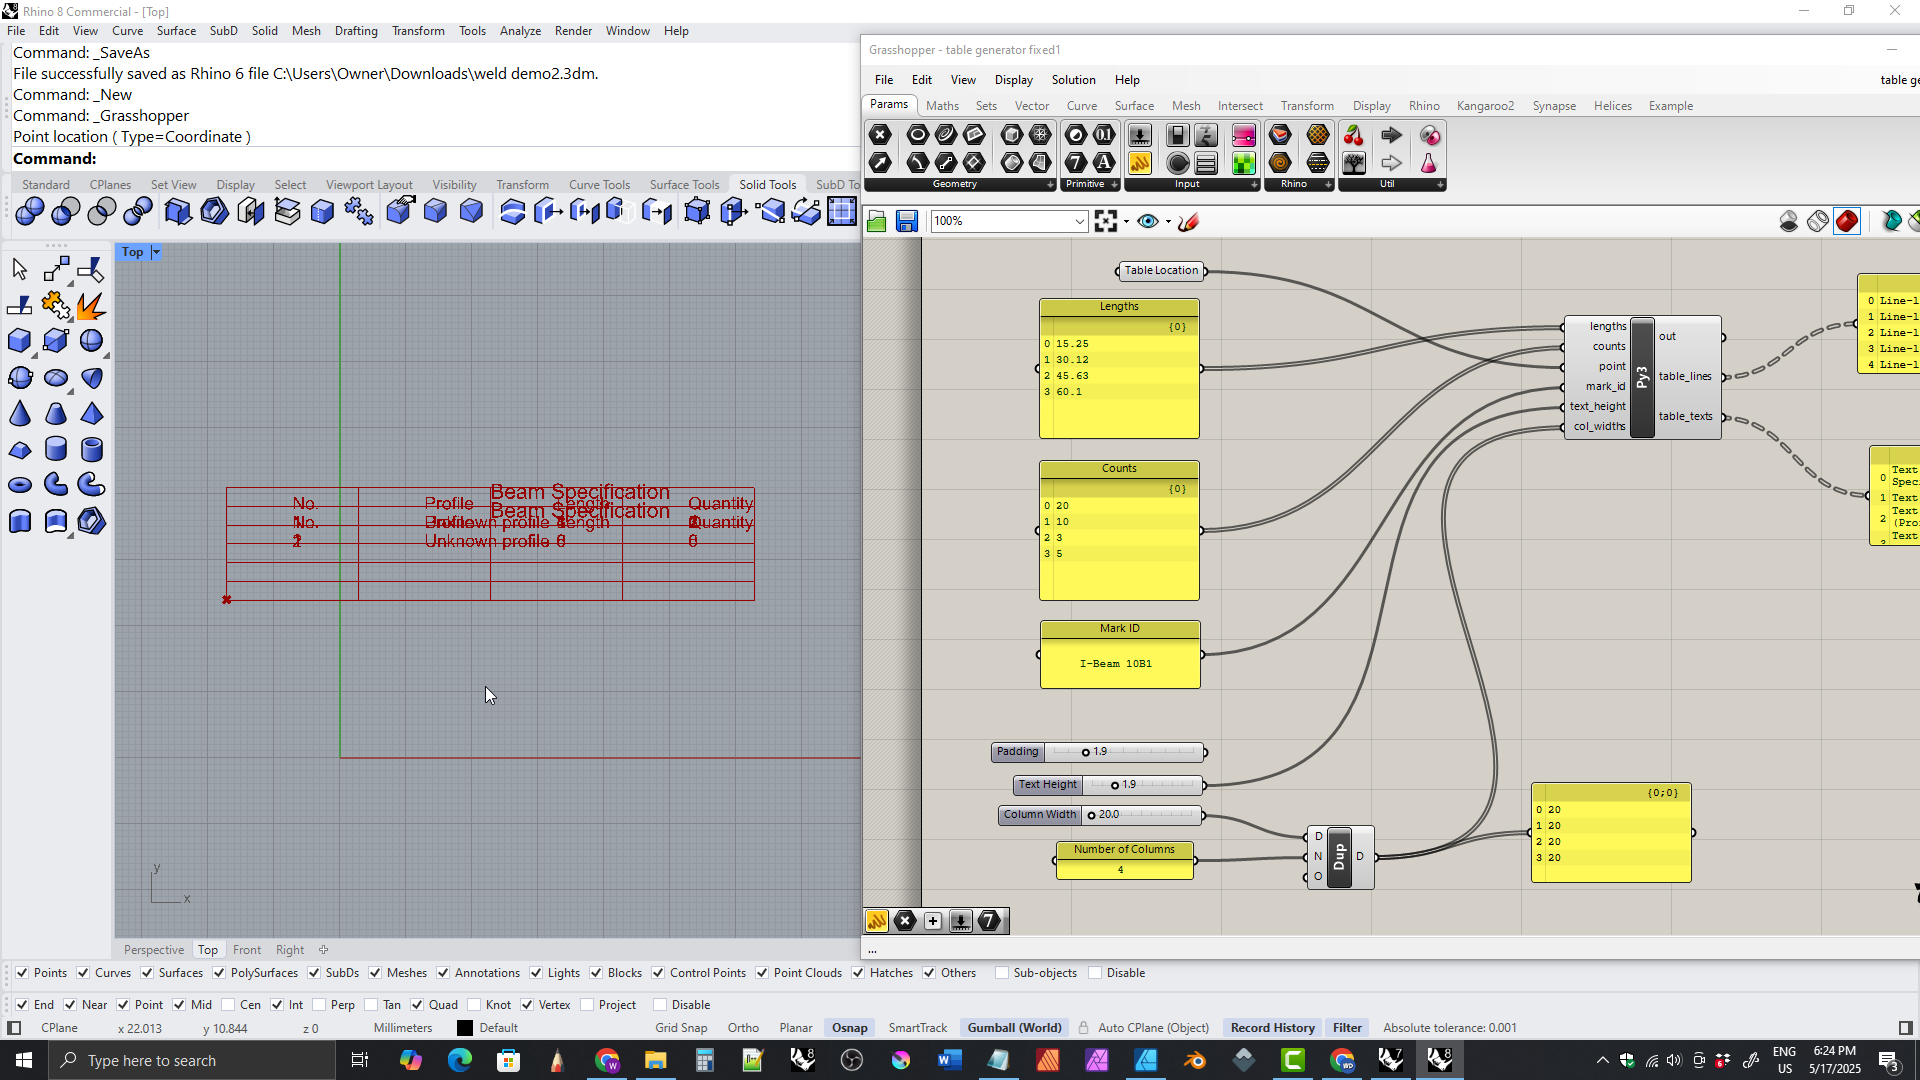
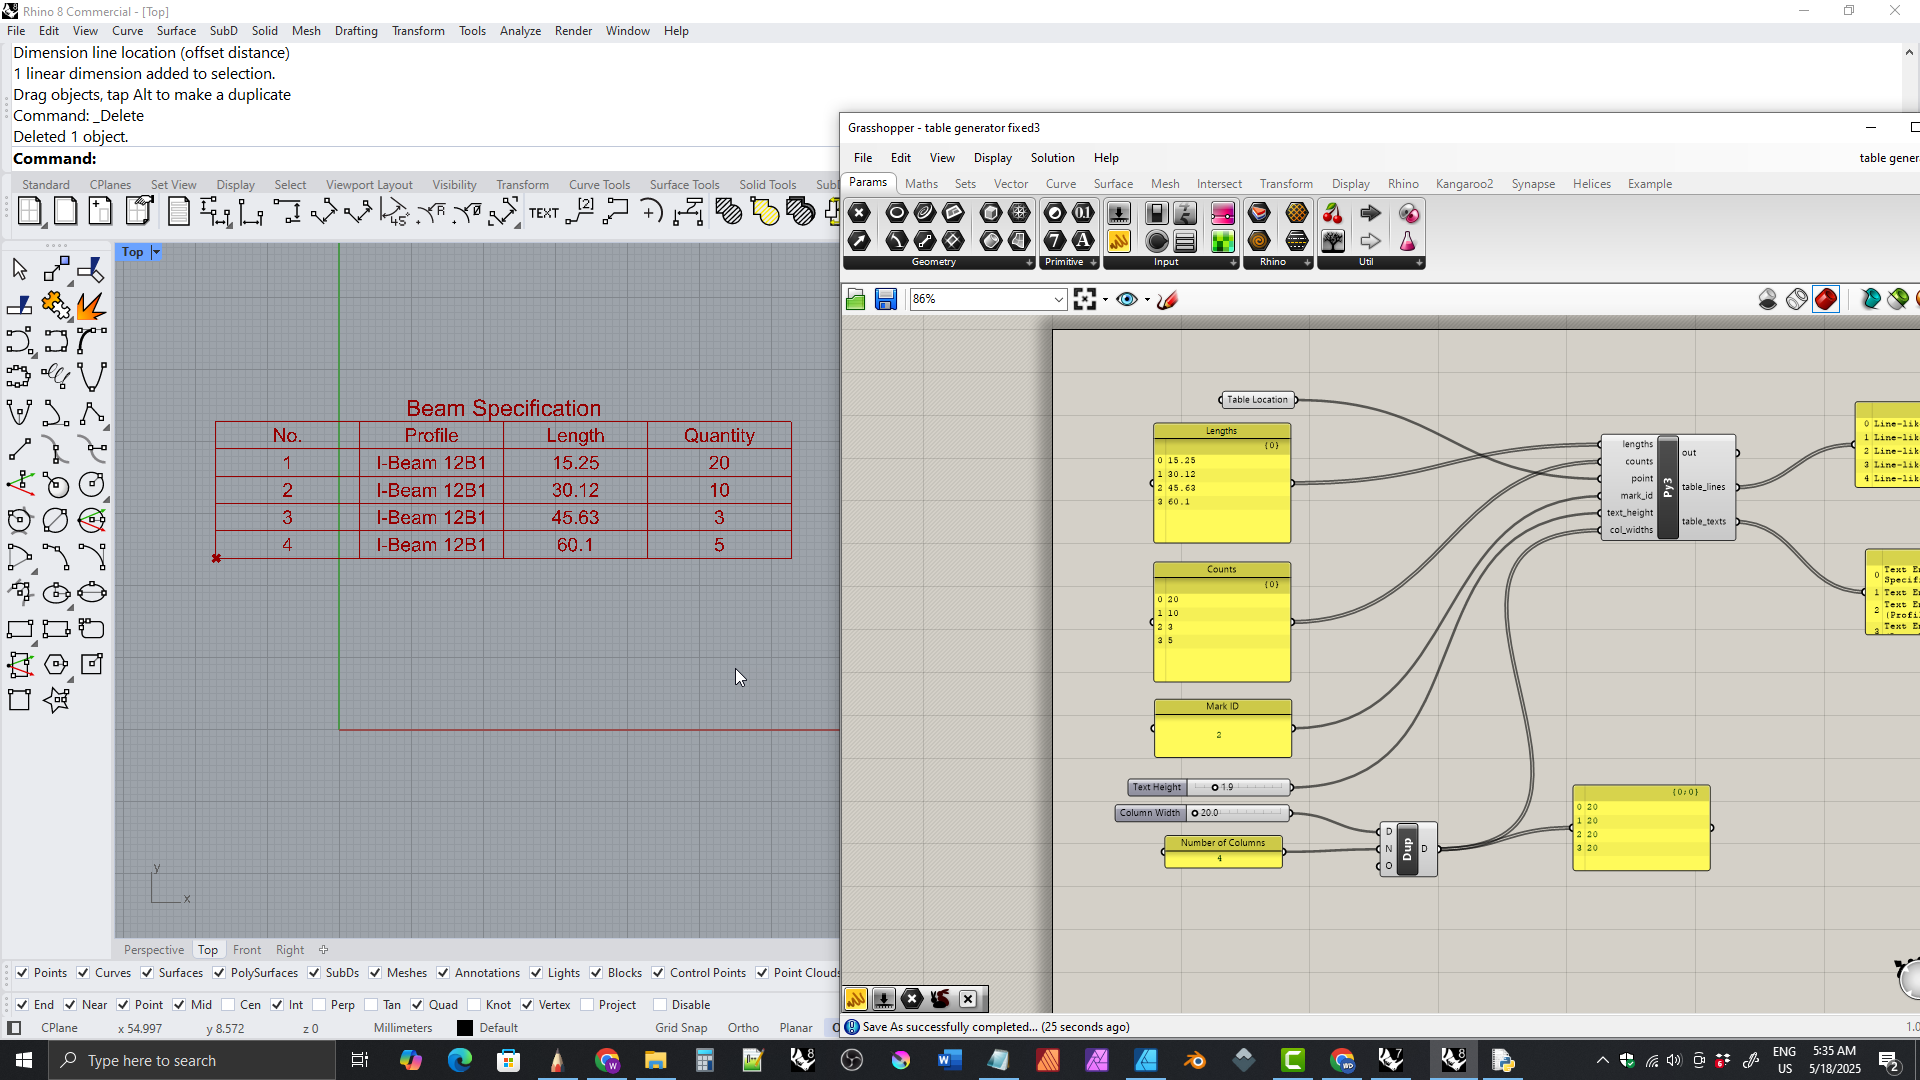
I got it working somewhat. It makes the table but the text is a jumbled mess.
In line 128, pt should be point to match how you named the point input on the component. table_lines, table_texts = draw_beam_table(pt, marks, lengths, counts, text_height, col_widths)
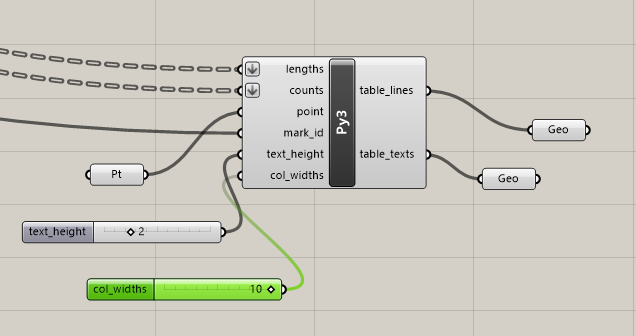
In line 31, col_widths needs to be a list of floats with list access, you provided a single float. I corrected this by running the col_widths slider value through a DuplicateData node. I also right-clicked on the variable slot on the component and changed it from item access to list access. total_w = sum(col_widths)
Line 56 is a problem, but I don’t know how to solve it. So I commented it out and then I commented out all references to the variable font_index. font_index = sc.doc.Fonts.AddFont("Arial", False, False)
Also, you may have done this, but just in case you didn’t, the location point slot needs to be given a type hint of Point3d or else you can’t get the X, Y, and Z components from the base_pt varialbe like in line 38. y = base_pt.Y + i * row_h
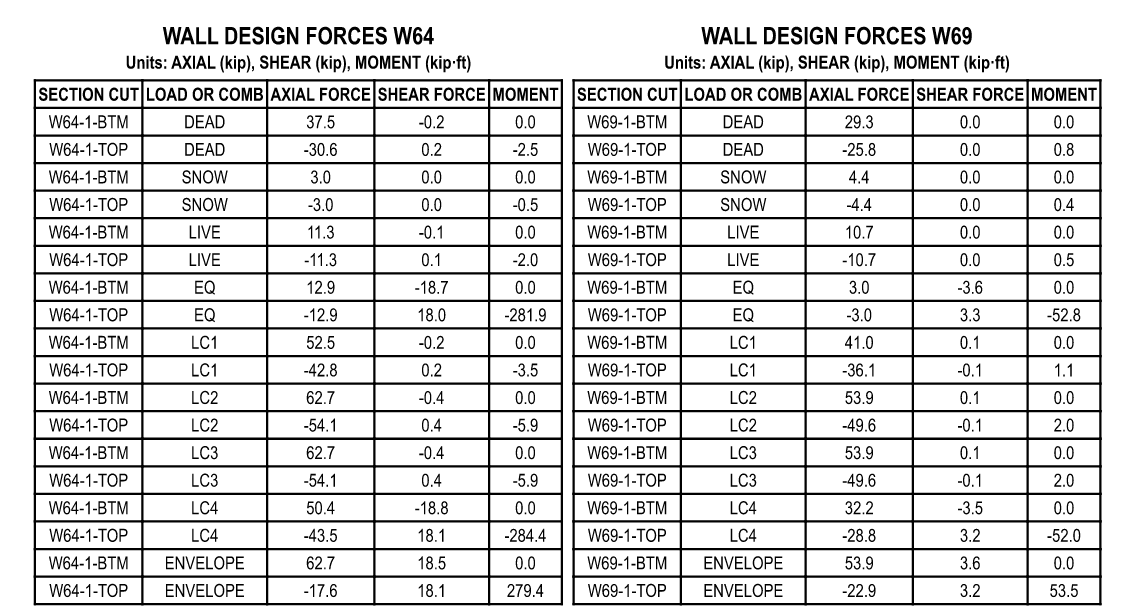
Another option if you want to work with the data in a data frame is to export the data from grasshopper to a .csv file. I have a python script that creates the .pdf files. This a secondary step, but you can post process the data in python.
Ok, I got your code working. I just needed to give list access to the other lists and set the type hints on everything. This made all the text appear, but it was not quite lined up with the grid. To fix that I changed the justification on the text in the cells to MiddleCenter and the justification on the title to BottomCenter.
Oh, and I changed the row_height variable to 2 times the text height rather than 1.5 because I thought it looked nicer. row_h = text_height * 2.0
Thank you so much for your help! Now I fully understand how to correctly output text and what my mistake was.
The line font_index = sc.doc.Fonts.AddFont(“Arial”, False, False) is totally optional—I somehow tried to change the font before figuring out text output.
I knew that to pass a point I need to use the Point3d type hint (that was the first thing I did). But I hadn’t realized that col_widths needs to be a list of floats with list access.
Hello, I’ve added CSV and XLSX export to the logic for creating my table. Now I’d like to try adding PDF export—if that’s possible, could you please share your solution?