Dear community,
While using Rhino.Compute to pair a fast Grasshopper script with a python optimisation script, I realize that the time taken per iteration is slowly becoming longer. The grasshopper script takes about ~1 second to run (in GH environment itself) and the optimisation script iterates it about 600 times.
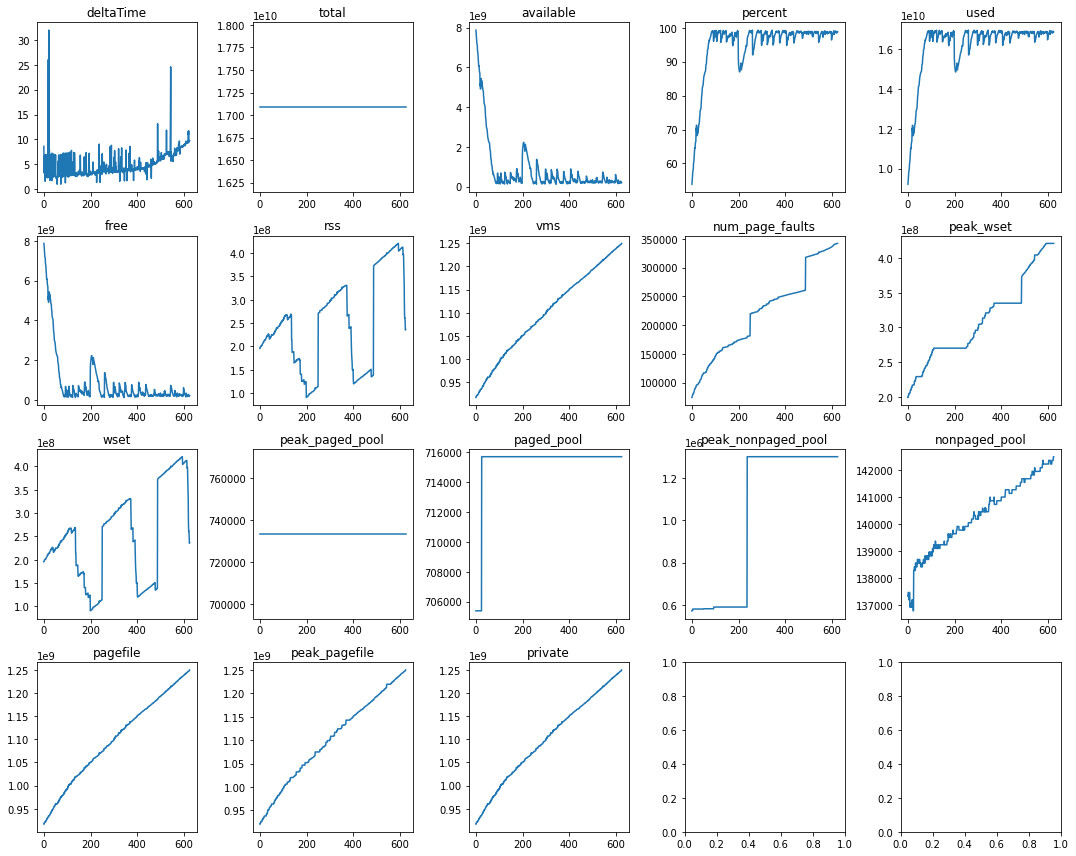
I am unsure of what is the root cause of this but I suspect that there is memory being cached somewhere that might not be needed. Below is a plot of available memory and cpu process tracked using the python library / method: “psutil.virtual_memory()” and “psutil.Process(os.getpid()).memory_info()”. Top left plots the time taken per iteration and shows that there is a gradual increase in time taken per iteration.
I hope that somebody can explain to me what is the cause of it and how can I force a ‘clear memory cache’ if it is the root problem. My current work around is to restart Rhino.Compute server on Visual Studio after every optimisation run. Thank you in advance!