Hello,
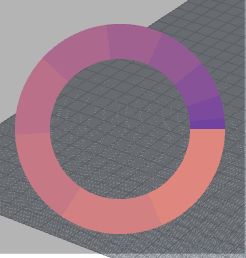
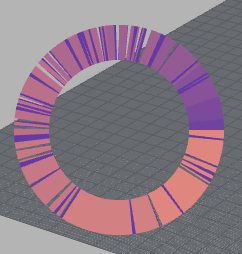
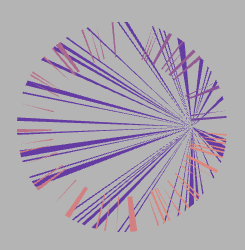
I have been developing a plugin for Grasshopper and a feature of it is visualizing data in a donut chart as an HUD on the Rhino Viewport. I am constructing a mesh for the donut chart that I’m then drawing on the foreground. I’ve managed to draw the mesh on the foreground using Rhino’s conduits, however the mesh preview is glitching quite a lot when navigating the viewport. Please see some examples below.
Generated Chart - Working
Generated Chart - Glitching
The way I approached this was by creating a class inheriting from the DisplayConduit class of the Rhino.Display namespace. In the DisplayConduit-derived class I’m overriding the CalculateBoundingBox and DrawForeground methods. In particular:
Mesh donutChart;

protected override void CalculateBoundingBox(CalculateBoundingBoxEventArgs e)
        {
            base.CalculateBoundingBox(e);

            donutChart = ConstructDonutMesh(e,new Rectangle(gap + 10, 450, 250 - 2 * gap, 250 - 2 * gap), 20, 1.0);

            e.BoundingBox.Union(donutChart.GetBoundingBox(true));
        }

protected override void DrawForeground(DrawEventArgs e)
        {
            e.Display.DrawMeshFalseColors(donutChart);
        }

Mesh ConstructDonutMesh(CalculateBoundingBoxEventArgs e,Rectangle rec, double thickness, double resolution)
        {
            // Get Draw Plane
            Line lineCenter;
            Line lineX;
            Line lineY;

            e.Viewport.GetFrustumLine(rec.X + rec.Width / 2, rec.Y + rec.Height / 2, out lineCenter);
            e.Viewport.GetFrustumLine(rec.X + rec.Width, rec.Y + rec.Height / 2, out lineX);
            e.Viewport.GetFrustumLine(rec.X + rec.Width / 2, rec.Y,out lineY);

            Plane drawPlane = new Plane(lineCenter.From, lineX.From, lineY.From);

            double radius = 50;

            Curve c = new Circle(drawPlane, radius).ToNurbsCurve();
            c.Domain = new Interval(0, 1);

            Mesh chartMesh= new Mesh();

            double currP = 0;

            for(int i = 0; i < percentages.Count; i++)
            {
                Curve[] dividedCurves = i != percentages.Count - 1 ?
                    c.Split(new double[2] { currP, currP + percentages[i] }) :
                    c.Split(new double[2] { currP, 0 });

                Curve arc = i != percentages.Count - 1 ?
                  dividedCurves.Length > 2 ? dividedCurves[1] : dividedCurves[0] :
                  dividedCurves.Length > 2 ? dividedCurves[0] : dividedCurves[1];

                chartMesh.Append(CreateArcMesh(
                drawPlane,
                arc,
                thickness,
                resolution,
                LerpColor(colors[0], colors[1], (float)i / percentages.Count)));

                arc.Domain = new Interval(0, 1);
                if (percentages[i] > 0.1)
                    e.Display.Draw2dText(
                        percentages[i].ToString("F2"),
                        Color.White,
                        new Point2d(arc.PointAt(0.5).X, arc.PointAt(0.5).Y),
                        true,
                        (int)(0.75 * textSize)
                        );

                currP += percentages[i];
            }

            chartMesh.Compact();

            return chartMesh;
        }
An object of the above class is created through a grasshopper component, with the SolveInstance method of it being:
protected override void SolveInstance(IGH_DataAccess DA)
        {
            List<double> values = new List<double>();

            if (!DA.GetDataList(0, values)) return;
            if (!DA.GetData(1, ref show)) return;

            if (show)
            {
                try
                {
                    if (hudConduit != null) hudConduit.Enabled = false;

                    hudConduit = new HUDConduit(gap, textSize, values);
                    hudConduit.Enabled = true;
                }
                catch (Exception ex) { MessageBox.Show(ex.Message); }
            }
            else if(hudConduit!= null)
            {
                hudConduit.Enabled = false;
            }
        }
Is there any very obvious point where this approach is failing? I would greatly appreciate your input and comments.
Thank you in advance.