Debugging Tips

Hi guys and gals,

I’ve been struggling with this lately, and wanted to check whether this is a common theme in the community or not. The first impression is that it isn’t because I hardly found any topic on the subject.

I develop mostly within VS environment, with is great for catching syntax errors, but I the truth is that runtime/logical errors sometimes can be a pain to catch depending on the functionality you’re developing, your coding style, how segmented is your code, etc…

For debugging, I typically log a message on the component output with critical information and in most cases we can relate the logs with the runtime error thrown by the component and things get sorted out sooner or later. The problem comes when we have to deal with very complex code, and then the runtime error message is simply not enough. The more complex the code the more verifications and logs we have to make, step-by-step, making development painstakingly slow and frustrating.

This hardship eventually makes you a more proficient programmer and I have felt this noticeably, but sometimes I just hit a brick wall and prefer to redo everything from scratch.

So, the bottom line is, I’m sure many of us have felt these pains, so I wonder if we can share tips for more efficient debugging techniques.

:partying_face:

2 Likes

I have a debug class whose methods are only called when compiling in debug mode using the [Conditional(“DEBUG”)] attribute, so I avoid sending messages to the rhino console for the user.

This static class also contains a geometry previewer using a DisplayConduit, which is very useful for geometry processes (before I had to bake the geometry which is more annoying).

I also have my own exceptions to synthesize the error messages into a few and more understandable ones (null or invalid argument, null or invalid process result, and not much else). But this is not too valuable.

To track the process flow, I have a class that records and measures the runtime in a nested way, but usually just using the VS Stack Frame is enough for me, or else, doing breakpoints, which allows to see the variable values to inspect if something is wrong.

Usually it is enough for me, but when it is not, what I usually do is take the logic to a scripting component in GH and make it work, although doing this is usually quite annoying.

On the other hand, all my tool logic is outside the GH components because I wanted to make my plugin only dependent on Rhinocommon, and this forces you to modularize the code in a less flat way (using more methods and classes), which helps a lot to find out where the problem is. Perhaps this is the most important thing here, because when you don’t know what line the problem is, you have fewer lines to look for it if your code is more encapsulated. And with more modularity you get more out of the VS debugging tools. I suppose this depends on what you are coding, but I usually avoid long flat logics, i.e. that you don’t call anywhere else in the project, but that I separate the logics for their usefulness even if I only call that method once. I do this a lot because I believe that good code is one that is self-explanatory and encapsulating segments of code helps this and therefore its debugging. I prioritize making the algorithm visible by encapsulating its main steps.

Another tip more important than it may seem is to name the variables describing what they do instead of using exaggerated abbreviations or key names, before I used to name them in the shortest way possible, but when you find a bug several months later, it’s really annoying to have to reinterpret its meaning, I learned that this practice is better (for effort vs. advantage) than commenting on important lines (which also helps to debug when time has passed between its development and the problem).

1 Like

I’d recommend to separate logiccode & create unit tests.

Perhaps you already know this, but since it hasn’t been mentioned here yet:
If you’re developing a plug-in for grasshopper you absolutely must take advantage of visual studio’s debug / edit & continue functionality. This will allow you to hit breakpoints on your code, inspect the value of local variables at runtime, and even edit the code on the fly and see how it changes the behavior. This is absolutely essential to my development process — it allows you to quickly iterate without quitting grasshopper + rhino and reloading every time you make a change.

5 Likes

Thanks for great tips, all around, especially @Dani_Abalde for the detailed contribution. You have mentioned some ideas I had for making a systematized approach to debugging, but been too lazy to implement yet.
In fact, you mentioned probably the most critical aspect to efficient debugging which is organized and properly segmented code architecture with easily traceable data flow between methods in different classes. Although I subscribe to this, generally I purposely avoid it in order to maximize the performance of the code, with chief ambition of sequential memory layout and access, which gets more unlikely with increasing number of allocations and calls. Finding a good balance between one route and the other seems to be the trickiest part for me.

If you have reason to be performance-oriented, those micro-optimizations can help I guess, I don’t know how much they help in C#.

Another part of my debugging that I forgot to mention is that I include gh files in the VS project where I do the unit tests for the components, save the test sources and test some use cases. Nothing like the Grasshopper canvas to do code tests :slight_smile:

If you have reason to be performance-oriented, those micro-optimizations can help I guess, I don’t know how much they help in C#.

Depending on the type of calculations performed they can be more than micro optimizations. Of course the greatest optimization is the algorithm itself, but memory layout is very important when dealing with hundreds of thousands, maybe millions of iterations per cycle.
Supposedly, the latest .Net frameworks do a lot more optimizations during compilation, namely the impact of the GC is close to negligible, so they say. It would be and interesting feature for future Rhino/Grasshopper development, but this is a whole different topic.

In Visual Studio, if you Attach the debugger to your Rhino Process, you cannot not only step through each line of code, but you can also use the profiler and observe memory, cpu and other things. Very useful.

Hi Tom, i’m using the debugging feature all the time, however, I can’t get the profiler to work anymore.

The most reason “feedback” that I get is:

Symbols failed to load for SomeExternal.dll. Cannot find or open the PDB file.

while these are not the ones I interested in (external and I enabled “enable just my code”).

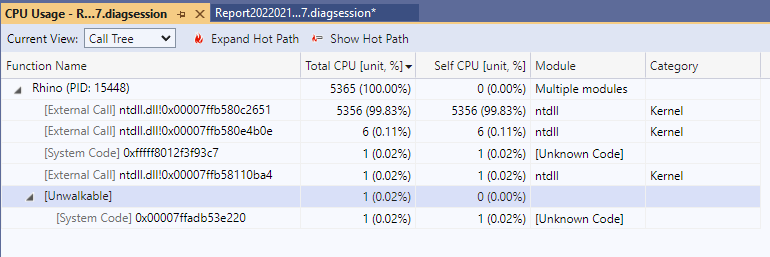
So the result panel looks like this:

Any hints how to get this to work? I got it working like years ago, just right away.

Regards,
WeiWei :wink:

Add the windows env var below solves the “external” dll (e.g. ntdll.dll) symbol load:

_NT_SYMBOL_PATH = srvc:\symbolsSymbol information

However, still no drill drown of own code possible:

Hello Andrew, would it be possible that you show how you use Visual Studio’s debug / edit & continue functionality with grasshopper? Would be a great help for me.