Connect a cull pattern or Cull nth component to the A output of the first sort component you are using.
Cull nth will cull every other line. Alternatively a 0 1 text panel input into the Pattern (P) input of the Cull pattern component will do the same.
Another option when you first create the contours, double the spacing and that will be the same effect but assuming you need to keep the lines and spacing as is, Cull Nth or Cull Pattern should do the trick to remove the lines after the fact.
If you get stuck, reach out and I’ll mock up an example for your file.
Thank you for your kind explanation. Your answer was helpful to find a way.
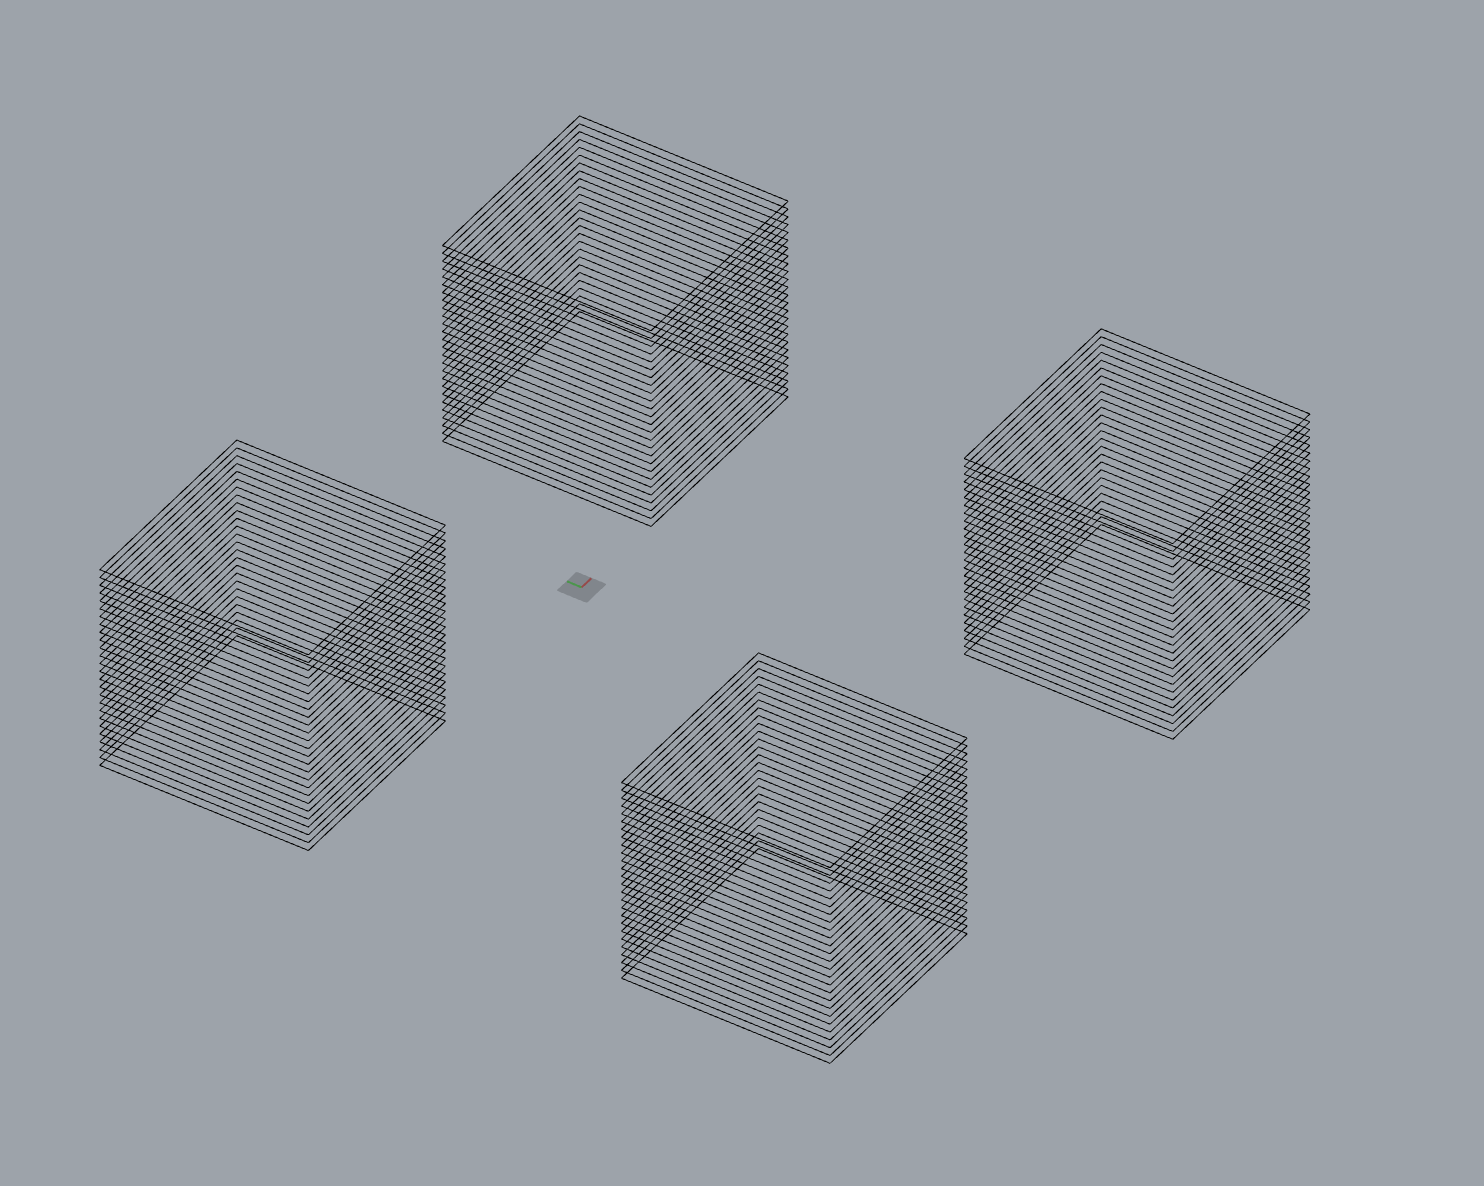
I think it’s almost done but still have a problem.
Do you know how can I apply Cull pattern to Group data?
Output is different from what I expected, and there seems to be a problem with the order in which te cull pattern is applied to the curve.
The current example is simple, but I’m going to apply it to a complicated contour, so I wish I could apply it in groups between the same Z values, but this part is still difficult.
Tree Statistics to get the data paths, then cull every other data path itself and then use the Tree Branch component to “list” the remaining data.
The issue with your cull pattern is that it is operating on a data tree so its actually culling the items in each branch of the data tree based on the 0,1 pattern, instead of culling the entire branch aka “grouped data” itself.
Thank you so much, your advice is working correctly.
There were so many curves to work with, and it was quite overwhelming, but thanks to you, it’s all resolved now.
I’m glad it helped! It’s easy to get lost in the sea of nodes and wires for sure. Often times when I’m stuck and take a break I realize it’s fundamentally a data structuring issue and sometimes it’s easier to manipulate the data rather than the geometry as one may expect.
But that being said I’m always learning new things about data trees. I don’t think I’ll ever master them haha