Hello, i’m wondering if anyone can help me with this. I’m a beginner with gh and python.
I’m trying to recreate the Spectral Grove pavilion from SoftLab with GHpython, and I don’t really know where to start. I created the circles in grasshopper (but maybe there’s an easier way to do it in python?)
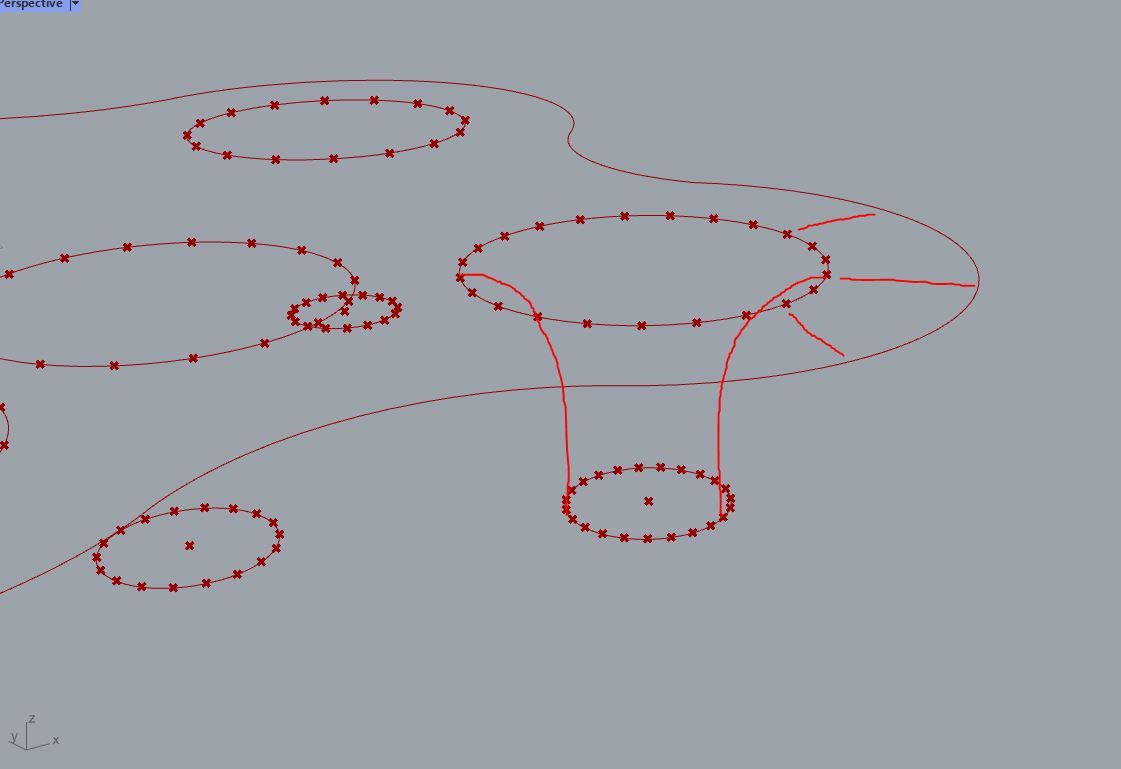
I’ve broken down the process into, what I think, would be the 4 steps to start from
create circles (6)
divide circles (23, 18, 14, 22, 24, 16)
create curve bewteen base circle and top circle
create straight lines
I don’t really know how to go on from step 2, once I’ve created the circles and divide them. Not really sure how to begin in python too.
Personally I wouldn’t go near scripting myself when doing this, grasshopper will be fine (and to be honest just CAD modelling it would also be adequate, but I guess there are learning objectives to be had here too).
Personally, if I were tackling this I would be creating a profile curve and then doing a polar array, rather than dividing all these circles which could get tricky to manage. If you use a polar array, you can then create a single vertical profile curve, extend it (as per the roof), rotate it and then trim it. The plan view of this project gives a clue that this was maybe how it was done:
This original curve could just be a 3-point polyline, then use the Fillet component (a). Then use a the Polar Array component around a centre point (b). Create many of these (with extended lines) which are then trimmed with a top curve using the Trim with Region component (c). For the top curve itself, you might want to play with the MetaBall component, which is usually horribly overused but in this case might generate a nice top curve that looks similar to the project. Finally, you can then use these setting out curves to extrude and create the steel plate elements themselves.
I think it would be remiss of me to upload a grasshopper file, because you won’t learn anything from it, but hopefully this gives you a new approach in tackling your problem. It won’t necessarily be the right approach, but that’s the beauty of these things, there are always different ways to do it. Have a go with some of the components mentioned above maybe.
It’s starting to look like something, i’m still trying to figure out how to trim with the region, I think my point manipulation makes it inaccurate but i’ll keep working on it. Now I sure have a better understanding of the process to recreate this, thank you. And I also appreciate now having the gh file with the answer haha. It’s a good way to learn.
The exercice is to try to reproduce a pavilion of our choice with python (for my university class). The grasshopper script needs at least one python node. In my idea I could have made the first few steps with python, but i’m not sure its realistic now. I thought something like Polar Array would exist in python but I can’t find anything like it.
In any case I think I could do the color attribute with python maybe, but I think this could be done with human plugin too.
For the trim, you need to feed the component a plane for the region, for which you can just cast the boundary curve to a plane, and it should work:
Interesting task… I presume if they want you to do some Python they have taught the basics in class? You would hope so! How about writing a simple for loop that does the polar array itself? You can use the Rotation transform in Python, something like this:
import rhinoscriptsyntax as rs
import Rhino
import math

newCurves=[]
axis = Rhino.Geometry.Vector3d(0,0,1)
num = 30
angle = 2*math.pi/num

for u in range(num):
    rot = Rhino.Geometry.Transform.Rotation(angle, axis, x)
    y.Transform(rot)
    crv = y.Duplicate()
    newCurves.append(crv)
a = newCurves
I don’t really use python in gh so sure there’s a better way, not sure I should be using the duplicate method for example - I simply can’t remember!
Once again thank you for your help. I tried to do what you said and managed to make the polar array in the python script, but it always apply a rotation of num = 30.
Ive tried to change that so it would apply to the right number for each circle, ex: circle 1 (23), circle 2 (18), circle 3 (14) etc… But i’m pretty sure i’m not doing the right thing, as you can see with my spaghetti code attempt.
I’m also not sure why my Loft between python and offset curves isn’t working
@diff-arch Thank you for your help with this, much appreciated
@johnharding the problem is the value for num changes according to the circle, so there’s actually 6 values for num (23, 18, 14, 22, 24, 16).
I thought I could do something like:
For a center point, look which circle is the closest;
and take the value of points on curve for that circle (as num)
Why don’t you do it all in Python with a step by step approach, like you described above.
Simply create a component and give it the circle centers as an input, as well as another one for the six division counts. Obviously the points have to be in the same order as the division counts.
After that, simply do this in Python:
At the end, you output for instance the closed boundary curves of the fins and do the rest with vanilla components, like the thickening part of the script that I uploaded a couple of hours ago.
If you have the same amount of points (center_pts) than counts (div_counts), and the points and counts match each other, you can do a ranged loop like this:
for i in xrange(len(center_pts)):
    current_pt = center_pts[i]
    current_count = div_counts[i]
Not sure about going to the trouble of nested loops, but just to say that a Python Component will work with corresponding indexing (i.e. run itself three times, when you input corresponding lists). For example, the original script but setting num = N for the following works just fine:
@diff-arch yeah that was my first idea because I didn’t knew how to do it otherwise, but I think once I figure everything out for this approach (and understand what i’m doing), I might give it a try, for learning purposes haha
@johnharding Thank you it’s working! You said the output will organise in tree branches, but once I try to apply the color wheel they are back in a list of 117 elements. Is there a way (with list item maybe?) to say; list 1: 23 elements, list 2: 18 etc
Ngl I haven’t master the list part yet