Scary. I’ve had the childish belief that the Merge component could be used to fixate list order, and I suddenly discovered that that was not true. Has it ever been preserving listorder or did something happen to it recently?
Fig.1 List input order gets scrambled:
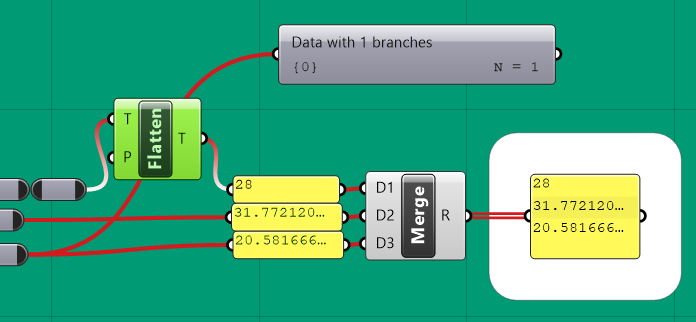
Fig.2 There have been claims difference branches can mess things up (the inputs are actually discrete values, so it must be the Merge component which made the branches here):
Fig.3 In any case, flattening the list doesn’t change the order:
This is bad. And extremely counter intuitive.
If Merge has always been like this, then a new component Merge Ordered is on the top of my wish list.
Your 28 value is in a branch called {0;0}, which sorts after the branch {0} which contains the other values. Merge does preserve order, but only within branches. If you want your data to also all end up in the same branch, you’ll have to flatten it (or graft it, depending) before merging it.
I get that branches would be sorted separately somehow. Problem is, all values seemed discrete values, at least to me. No (explicit or visible) branching was input to the Merge component. All three inputs shown below:
Why should I assume that two out of three discrete values form a “bransch” without me explicitly forcing it to do so? I see nothing intuitive in this, and therefore your answer - in this case - doesn’t make sense either. < looking blushed >
Yes, but that doesn’t explain where the bransch came from.
Problem is, if you don’t see indications of that something comes in bransches, or worse yet, from different bransches, then you would not notice (unless explicitly analysing each output with the datatree component, or hovering over them). That’s a recipe for disaster. And it defies the purpose of “visual diagrams” because critical info is not indicated by the diagram.
Well, it took me a full workday to track this thing down, because in my paritcular case I knew that the result was wrong (Galapagos gave one answer, while a number series approach (pictured) gave a completely different answer, otherwise I wouldn’t had known that the whole thing returned rubbish).
Yes, you cannot see it here because it’s a single branch, even though it’s {0;0} it is still a single branch, that’s why it is not dashed, when you merge them later then there are two branches and the wire is dashed,
The problem is not in the definition you uploaded but somewhere before angles
Yes, there is something wrong. When I hover over the angles there’s no indication of that this is a branch (“{0;0}”). Thus I am not hinted about the need to flatten the output. Which is the problem causing hidden erroneous end results. Which defies the purpose of “visible logic” in diagrams (it’s not visible in the diagram).
I guess you manually inputted that list through Set Multiple Numbers?
AFAICS it is the only way to create such a list in {0,0} by directly typing : {0,0} at the start of the input:
And as an aside, for your own sake, can you please stop piping data through a panel while you input it to other components? You’ll keep yourself then from running into conversion troubles…
No worries, I’m well aware of the “no-floats-through-planels” rule of thumb. I never do that except for illustration in this case, making the screenshots self-explanatory.
The angles originally came from a Series component, mentioned above.
Edit: The Series component does yield a branch (“{0;0}”) with 50 numbers, but no indication of that it’s not a flat list. Or, the problem is just that, the wire represents a flattened list.
That is true, the wire display type only differentiates between no-value, one-value, one-list-of-values and multiple-lists-of-values. It doesn’t overtly tell you whether your one value or even your list of values is stored under the most basic path {0} or some more complex path.
The wire coming out of the Merge component would have told you that -instead of what you were expected- you ended up with multiple lists. And the text panel you were using to inspect the output would have told you as well, except the index and path display on it was disabled.
Sadly the tooltips also do not tell you what sort of path a single value is stored under. I think this was an oversight, the tooltip probably should mention this detail:
It’s something you have to keep in mind when operating on data structures. Paths may be grown with additional indices without you specifically using any Graft operations. Plenty of components just add these extra numbers because they know that if the input would only be slightly more complex than it is now, they will have to to keep output data from mixing together. Rather than deciding on the spot whether it makes sense now to add an extra zero to the output paths, they always do. This means that a lot of paths are more complicated than they need to be, but it also means that the paths are consistent. At no point will you suddenly get a different data tree topology because a certain operation yielded only a single value this time instead of the usual two.
That would definitely have increased the chance that I would have noticed this. But that would still require explciit check (the hovering over).
Best would be to somehow indicate when a bransch is coming at you, or being sent. If not on the wire so perhap on the outputs/inputs with a “…” symbol or something. Then the visual diagram paradigm would still hold.