Not quite, sorry i didn’t explain that well. I have 2835 “objects” (segments of boreholes where geological conditions are assessed as different). Each of those has 30 ish pieces of data, in many cases the data is simply “empty” where no data was recorded - but my methods to date required my lists to be uniform (hence the empties).
So all up, 90,000 cells of data - 30ish cells, for each of 2835 objects.
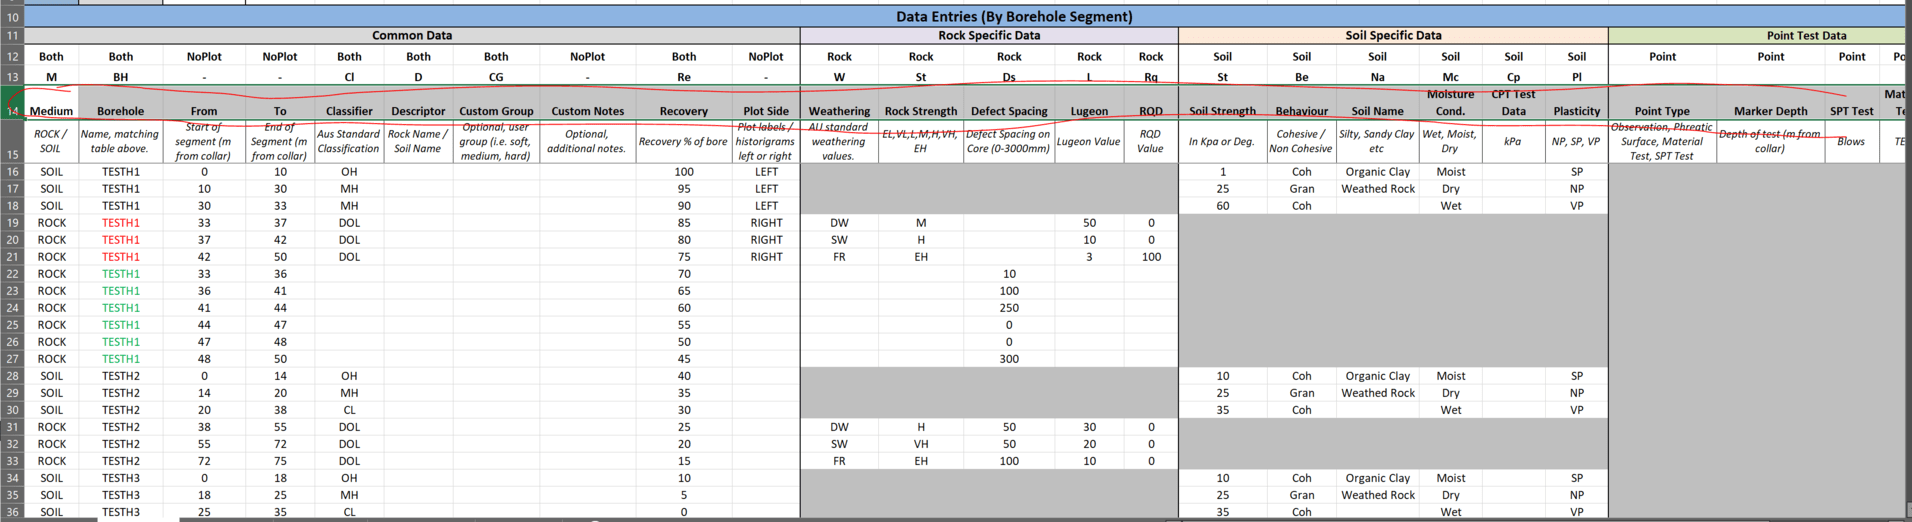
If i go back to the spreadsheet in my second post, that should make it clearer. You see if I am logging “ROCK” data (far left column) then the “SOIL” data is blank, and vice versa - so every branch has a fair few empties.
I should probably also provide some context, the reason for this work is 3D visualisation of this geotech data to get a good feel for foundation condition, fracturing, failure wedges, weak zones etc.
Any of the data in the sheet can be visualised based on numerical value, auto assignment by unique entry or by a shader lookup (for common geological data).
The output of the script looks something like:

Where in this case data is shaded by classification:

We build on this for a 3D geological model of the dam foundations:

Worth noting this is work from about 5 years ago, and the script has become considerably more capable since.
I will work through some of your example files for datasets, and see if your tools can give me a more efficient solution than where I am currently at, then report back ![]()
Thanks again for the input!