I am beginner with Eddy3D and I have some newbie questions on wind speed.
From the local weather station I got average windspeed coming from south. (4,27m/s) This is measured in 10m height. At the same time I know what should be roughly the windspeed 2m above the ground provided also from weather station. (2,55 m/s)
After analysis, the vectors suggests that there are wind speed exceeding 8m/s. Probe points are put 2m above the ground. Could you please help me to solve this riddle? Maybe I am reading vector output wrongly. Thank you a lot for your help!
I am not sure which probing point you are referring to but it sounds reasonable to me that you see local speedups exceeding 8 m/s (in the vicinity of corners etc.). What were you expecting to see?
thank you for the swift reply. Really appreciate it!
Since I am not really wind expert I am relying on data from local weather station. I was expecting slower wind closer to the ground around 2 - 3 m/s. By probing point I meant points, which I used. for measuring wind vector. I placed the 2 m above the terrain so it copies the topography. See picture below.
I also wondering if it can be somehow related to the size of Domain box. For now the domain box is quite small, just big enough to fit the building in. Would it help if it was a bit bigger?
In addition, how many simulations are you running? For a final simulaiton aim for 2-3,000 if you can. For an initial rough one, then 600-1200 should be fine.
You can also take some slices in the Z direction (Vertically) where you can see your ABL.
thank you for the info! I will try to enlarge to bounding box. I partially found out the problem. The model which I was using was referenced to sea level. Therefore the model was roughly 30m above 0,0,0 plane. Since in ABL I set Velocity to 4,27 m/s and Zref to 10m everything was calculated as if the building was starting from 30m. After moving the building to 0,0,0 the wind speed looked better. Now it matches to weather stations data.
Regarding to iterations, I started with 1500 iterations. But the calculation stopped at 340. Does this mean that it converged before reaching 1500 iterations?
So sorry for the delayed response. Yes it looks like the model converged after 340 iterations for that wind direction. It will auto-stop after it has converged, even if it does not reach the # of iters you specified.
Hi Remy! Could you help me with this one? My simulation seems to be converging, but my vectors are just too small and I can’t get this same colour gradient as everybody gets on their simulation. Why is this happening?
I need some more information before I can help you, it is very hard to know what could go wrong just from these screenshots.
Did you use a template in GH to set this up? If so which one, and what were your settings…if you want to attach the GH file that would be great.
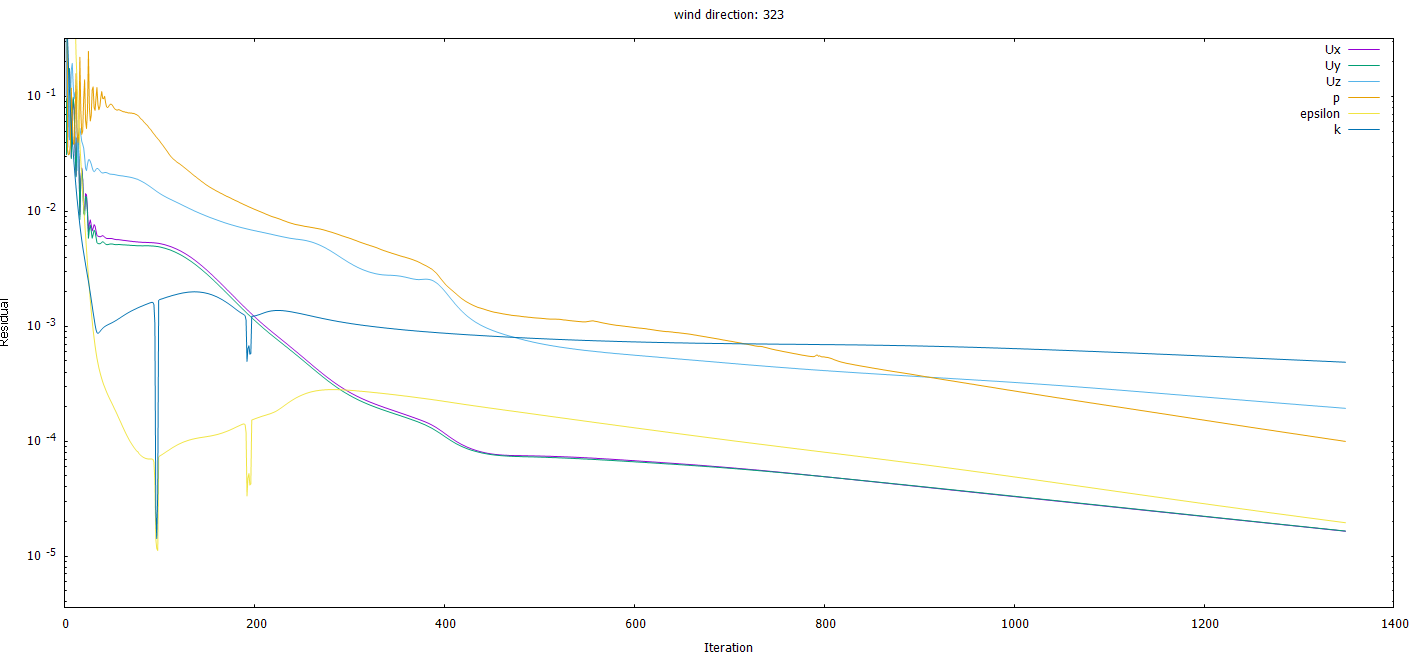
How many iterations did you run? Did you look at the residuals to see? Converged will not always look like the “lines come together”, if the lines come together and look erratic, then the simulation crashed.
In the images above, what variables are you looking at? The top one looks like UTCI to me, but I am not sure. If it is UTCI, I have had that same issue. Part of it is likely because the UTCI tool in Eddy is still experimental. It also works less reliably if you have few iterations. The bottom one looks like the wind flow. It looks to me to be bad data, but the sizes of the arrows can be controlled in the portion of the script where you visualize them, there should be a slider or panel to control the size.
I can be most helpful if you attach your rhino and GH file here complete w/ all of the geometry and whatnot. Where is this simulation located? Did you use an EPW file?
the file I’m using is this one SIMPLE WIND ANALYSIS2.gh (30.5 KB)
the geometry is internalised. And the results are mostly the same for every simulation I’m doing.
I ran 2000 iterations but the simulation ended earlier because it converged earlier, it was the simple wind analysis template, and it looked exactly like the image above, I’m just not able to achieve this gradient unfortunately. Here’s the residuals graphic for the first image I sent above.
The variable I probed was velocity, and the arrows still looking small, did not used the EPW file on this one. And did not used the UTCI for any of the simulations above, just the gradient that was different.
The second image was a file from another user from the forum that I downloaded, just toggled buttons and did not get the same results as he got, does it have something to do with BlueCFD?
The model is a street canyon from my city in Brazil, this is for my masters degree, the only thing left is try to make my CFD simulations to work correctly.
Heres the rhino file I’m using as well MAPA AD COMFORT - 1940 - SOLST DEZ.3dm (4.5 MB)