I’m unable to get sine wave variations in graph mapper. All the extrusions look the same.
sinewave extrusion issue.gh (15.5 KB)
hi there,
the graph mapper output was used as target domain for the remap numbers component, but the graph mapper itself should be used to directly remap the values
I have replaced the remap numbers component with the graph mapper, tweaked its domains, and it looks a bit better… is this what you were looking for?

sinewave extrusion issue_maybe.gh (10.8 KB)
Yes! Thanks a lot! This is exactly what I was looking for!
@inno You have used all different values in x0, x1, y0, y1. How do you decide what value to put where?
I have used this domain for x0 and x1

and this domain for y0 y1

not sure if those are exactly the domains you wanted tho 
I am getting confused. The values on X axes are the ones which are on the left hand side. The values on the Y axes are the ones which are the resultant of the graph mapper i.e. the values on the X intersect with the curve within the graph mapper and get converted to the values on the Y axis. Right?
I am not able to understand four values in the graph mapper instead of usual two that I have been using.
Hi -
That’s correct, yes.
There are always 4 values “in” the Graph Mapper; 2 to create the X domain, and 2 to create the Y domain.
-wim
1 Like
The domain for X (i.e. values for distances coming from left hand side) has to be created manually in the graph mapper? Doesn’t it automatically create the domain of those values inside it and maps it automatically on Y domain?
Hi -
“values […] coming from left hand side”
I take it that by that, you mean the input for the component.
The input to the Graph Mapper component can be a single number, a list of numbers, a domain, or a list of domains.
You have to set the “internal mapping domains” (indicated in red in the following image) manually; that’s not something that comes from the input.

-wim
Yes. Exactly I mean that only.
Okay. Now how do I decide the internal mapping domain?

Here, in the input I have entered numbers 2,4,8, 6.
They got mapped by the graph mapper using the values y[0]=0 to y[1]=1
What role do x[0] to x[1] play here?
Hi -
Modifying the mapping domain (X[0] to X[1]) allows you to “1D scale” the domain in a way that might be easier to control than trying to modify the graph with the grips on the curve.
The two graphs at the bottom provide (more or less) the same result:

-wim
I am still not able to understand why two different graphs having different wave forms with different domains on x axis are giving the same result.
Hi -
That is not generally the case! Firstly, the sine graph is special because it is repeating the same shape “outside” of the component. Secondly, you are only getting the same result for inputs that are a multiple of the scaling factor of the domain.
You’ll have to experiment a bit with the different graphs to see which continue beyond the component’s window, which repeat, and which stop.
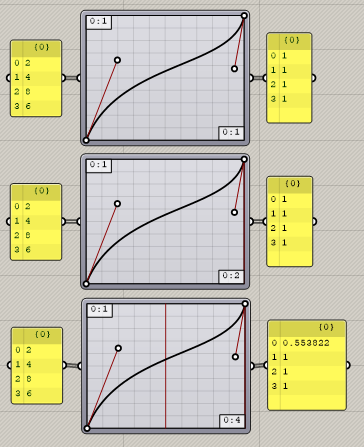
For this Bezier graph, for example, you see that there’s only a non-“1” output when the X domain is large enough to evaluate input that is somewhere between the min and max of the domain.
-wim
1 Like
This means that the input values 2,4, 8 and 6 got converted on a single straight line graph that starts from x=0 and ends at x=1, right?
What does the red straight vertical line in the third graph show?
Hi -
I’m afraid I don’t understand this.
That shows the “2” input. There’s a red straight vertical line in the second and third graph that is all the way to the right, showing all the other inputs (well, for the third graph, all the others except for “2”). When you use a domain as the input, you won’t get those red lines.
-wim
1 Like
The values 2,4,8,6 got converted to maybe 0.2, 0.4, 0.8 and 0.6 on the single straight line graph inside the graph mapper that starts from x=0 and ends at x=1, right?
Okay.
It’s not possible to answer that question because it completely depends on the Y domain.

-wim
I will rephrase my question
The values 2,4,8,6 got converted to maybe 0.2, 0.4, 0.8 and 0.6 on the single straight line graph inside the graph mapper that starts from x=0 and ends at x=1, before being mapped to the y axis.
Yes?
I always leave the Graph Mapper internal domains at their default (0 To 1) and explicitly ReMap as needed before and after.
1 Like