McNeel Forum
GH: Merge component doesn't preserve order - Bug?
Grasshopper
ivelin.peychev
(IVELIN PEYCHEV)
September 1, 2018, 1:19pm
5
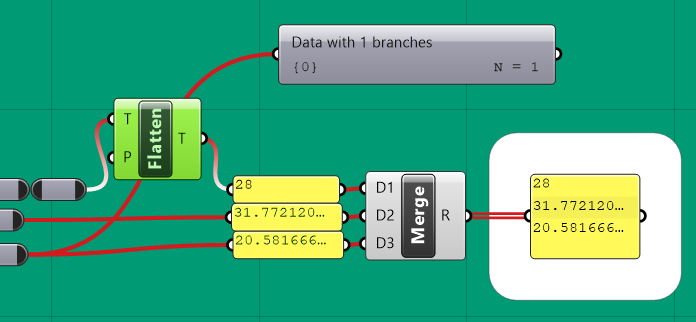
Flattening the stream of “28” seem to do it:
image.png
696×322 29.4 KB
Branch comes from the very beginning of that stream
Add in-between outputs to List Item? ZUI
show post in topic