What I have here is data ranging from 0-X created with range, and what I am trying to do animate the radius of a curve growing from 0 to its final number (X).
But when I try to remap the numbers to flip them around. So, 0 is the highest number, and in turn, the largest radius. And the numbers with the originally highest numbers, are the smallest circle radius.
From that, I want to use list item to animate through the circles to see them grow.
I am having some issues with it being fluid, so this reason I have using cube root to change the distribution of the numbers, so the circle grows slower at the start, and then quicker at the end. Does anyone have any idea how to achieve this? maybe through graph mapper, but I had no luck.
Let me know if the question needs clarity.
Best,
T
Thank you. But I think I didn’t explain the question great.
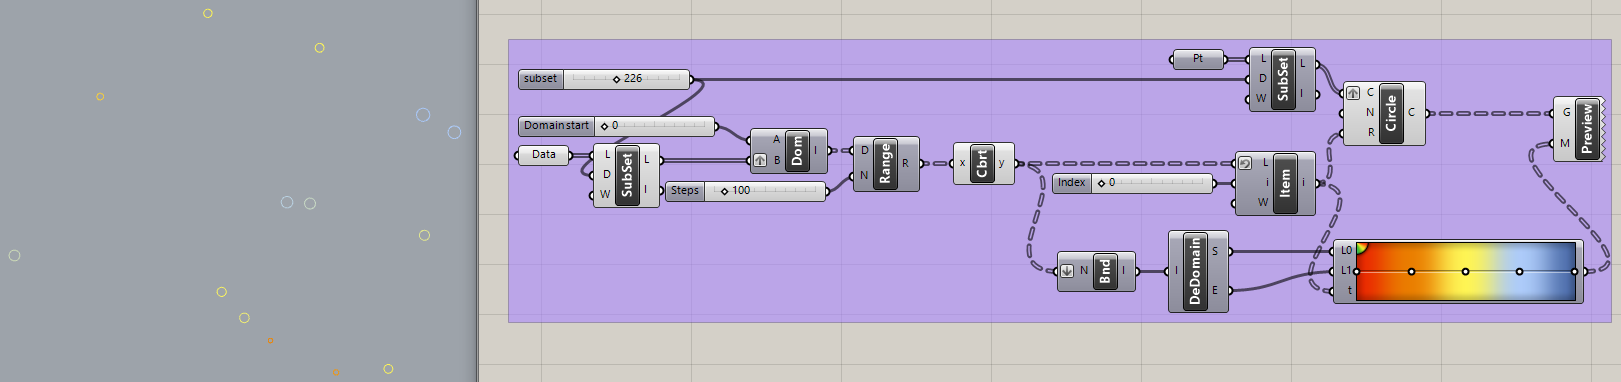
At the start of my original script, I have ‘data’, which contains a series of numbers, and then I use to create a domain starting from 0 a use range to generate steps between the two numbers so I can create a smooth animation between the two numbers.
But the numbers in ‘data’ at the start, then I want the highest values to have the smallest radius in the circles, and the lowest numbers to have the largest radius, so flipping the numbers around. I am mapping a distance to an object, and if it’s a low distance, it would be a low number, created a small circle, but I want to highlight the lower distances. Hope that makes sense…
My second question about the distribution of the numbers, was where I used CubeRoot, to have control of the distribution, this second question is less important and more a visual challenge. But, the reason for the cube root was to have the difference between the circles more apparent. If you don’t use cube root, I found the circle size to be too consistent throughout.
544 numeric values becomes 544 domains, each split by 100 using Range to get 544 branches of 101 values each, totaling 54,944 values. That data tree is then flattened and Cube Root is applied TWICE (!?) to each item, ReMapped to a different domain and partitioned by 101 back into the same tree structure you flattened. Why?
Then the first value of each branch is used as radius to make 544 circles while the other 100 values in each branch are ignored? Why?
Then Bounds is used to obtain the same domain you created as the ReMap ‘T’ (Target), which you already had. Why? Maybe you meant to get the bounds of the radius values?
This doesn’t make much sense to me?
P.S. Because you used Range, all the values in each branch are effectively “sorted” from zero to the Data values and after ReMap, zero in each branch is mapped to 17 so all circles have the same radius, 17. WHY?(I mean “Why are you doing this?” and what did you really mean to do?)
I made some changes that make slightly more sense (to me) and the slider connected to List Item now “animates” the circles from large to small. I added a ‘subset’ slider so that only 10 values can be used for testing instead of 544.
Thanks for the detailed comments, and feedback. But maybe some of the answers that you’re looking for above will come from my next comments.
The script you shared im quite confused about what it achieves. I presume the list item at the end is controlling the animation of the curve growing itself, but when I have it at 0, it produces 295936. Why? ;).
My aim here is to simply grow the circles from a radius of 0 to the end numeric value (coming from the data component). But, I want to flip it to the highest number in the ‘data’ component is actually the smallest circle. And the lowest number in ‘data’, would be the highest radius circle.
Also, the script at the bottom actually achieves what I want, apart from the fact I want to flip the circle size. So the smallest circles you see, i would like to the highest circles, and vice versa.
You don’t need ReMap for that, you can just reverse the list.
But graft does get the correct number of circles. They are probably all the same size because of ReMap. Here is a version that doesn’t use ReMap at all, though I can see why you might want to make them bigger? There are many ways to do that. Have fun.
Thank you again for taking the time to look at this. Unfortunately, I just didn’t think I formulated my question very well. What I was after was to not simply flip the numbers in a flip but flip the distribution. I did figure it out in the end. I just needed to remap the numbers before creating the range.
My aim was to change the spread of the distribution. Currently, my data is highly skewed towards the higher range, so I basically wanted to spread it out more to see more difference between the circle size, instead of seeing 90% of the circles one size and only a select few fitting within the lower bound. I presume graph mapper might help me but I had challenges getting it to work in this case. So my hope was CubeRoot would bring the numbers closer together. However, not much experience in this case and was merely experimenting …
Graph Mapper can be used this way. Shaping the graph will affect the distribution. If you want to reverse the effect of the slider you can right-click it and add the expression “1-x”.