Here some new illustrations, it is a good exercise for tree navigation. It remembers me the first algorithm I made for fault tree visualization some 25 years ago!
So I changed a bit the algorithm. Now I have 2 logic, a max number logic or a max number of recursion level. Blue dot = prime number
max number = 1000
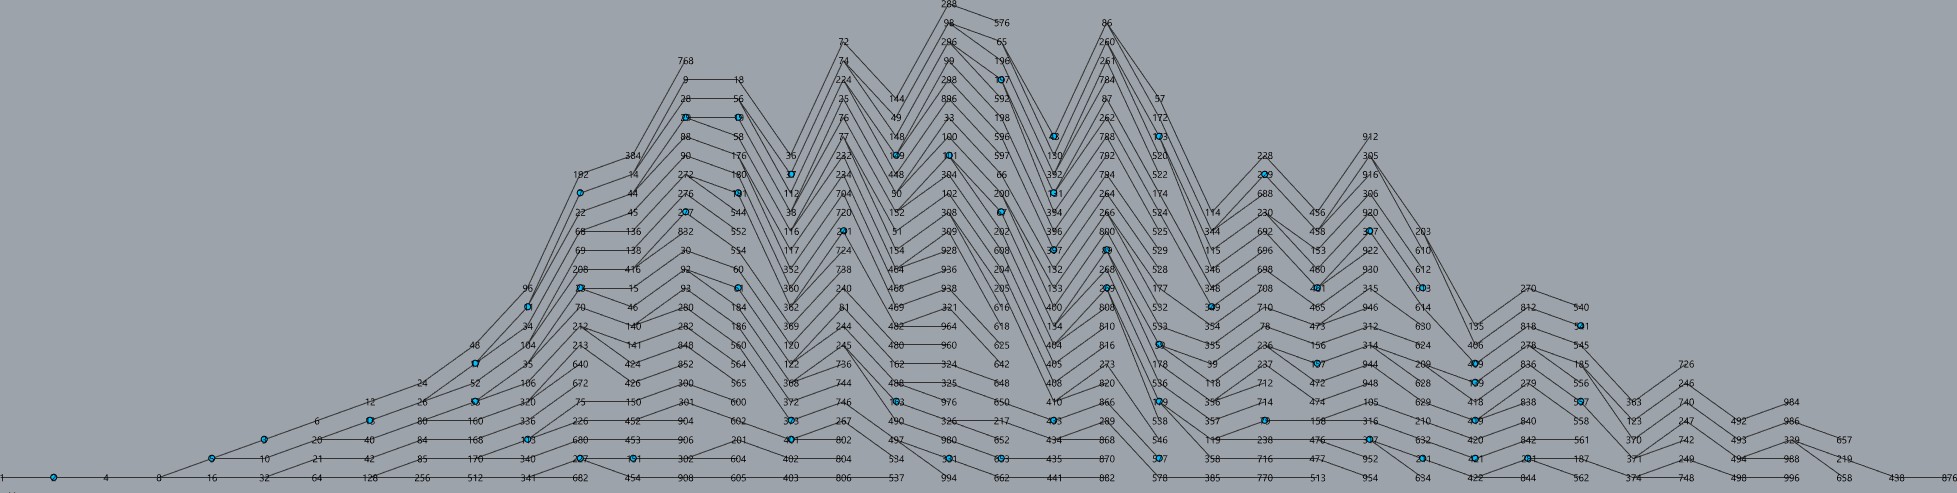

Max Level = 15 (16 levels as I begin at 0)


I implemented some way to change the position of the “trunk”. There is a slider from 0 to 1, 0 on top, 0.5 on middle, 1 on the bottom


You’ll see on the bottom the power of the graph 2.
Collatz_LEGACY [Jan-01 '21, 2213].gh (46.9 KB)
A bit like this one
And also possible to transform it to a circle


Collatz_LEGACY [Jan-01 '21, 2234].gh (56.5 KB)
And some 3d version


